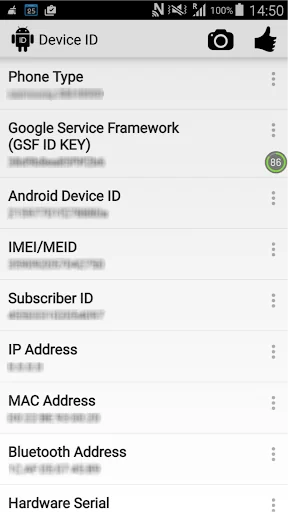
Support Device Information
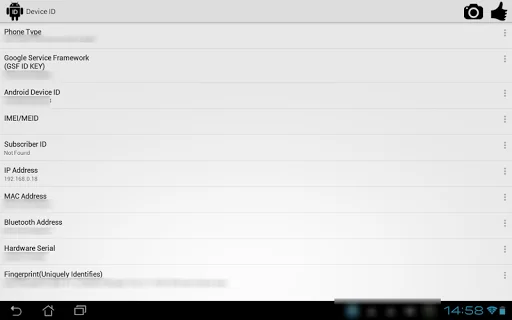
1.Phone Type
2.Google Service Framework(GFS ID KEY)
3.Android Device ID
4.IMEI/MEID
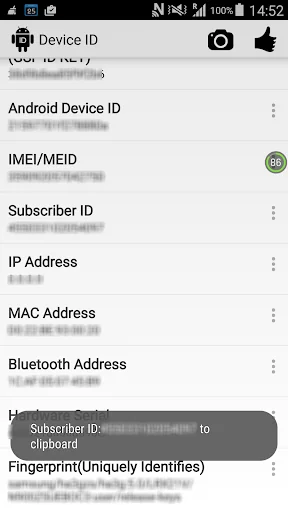
5.Subscriber ID
6.Internal IP Address
7.External IP Address
8.MAC Address
9.Open Advertising ID
10.Hardware Serial
11.Fingerprint(Uniquely Identifies)
12.CPU Info
13.Memory Information
14.Memory Total
15.Memory Free
16.Battery Status
17.Battery Health
18.Battery Level
19.Battery Plugged
20.Battery Voltage
21.Battery Temperat…
Each forecast combines App Store rating, ratings count, monetisation model, pricing tier, IAP signals and ad-supported flag.
The base estimate is then multiplied by a per-category scaling factor learned from apps with founder-verified MRR.
Every number on this page comes from public APIs and bumetric's own snapshot history.
Full methodology covers input variables, accuracy bands per category and how we treat apps without comparable anchors.
See also the live data on Device ID's tracker page for current rating, reviews and snapshot timeline.
Building something similar? Get a free AI audit with $-revenue forecasts for every recommendation.

 Weight loss diary&BMI Tracker
 BFC - Brightness Fast Control
 City Live by Teclock
 CEM Ambiente
 Kazakh Keyboard Plugin