What is DGO?
DGO is a streaming service that offers complete online programming, with live TV channels and on demand content.
The Best of DGO
Enjoy everything DGO has to offer:
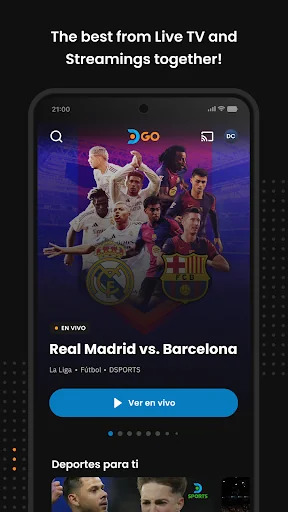
- Exclusive sports and live channels.
- Plans for everyone.
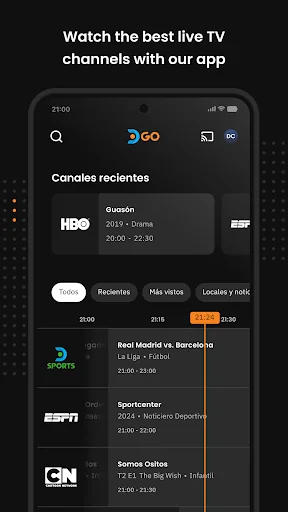
- More than 50 channels.
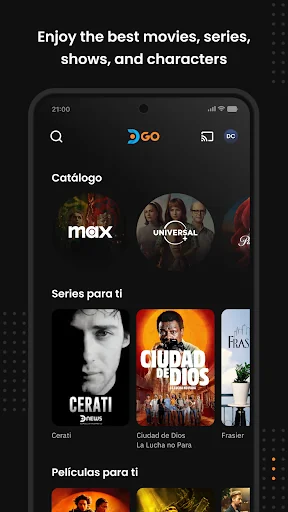
- A wide selection of movies and series.
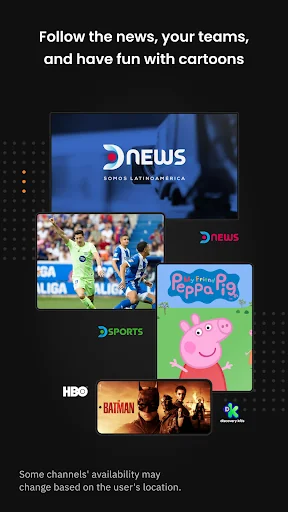
- Children's entertainment.
- Free exclusive channels like DSports, Dnews, and Dfight.
Where to Watch
Stream on your smartphone, tablet, computer, or smart TV. Download the DGO …
What is DGO?
DGO is a streaming service that offers complete online programming, with live TV channels and on demand content.
The Best of DGO
Enjoy everything DGO has to offer:
- Exclusive sports and live channels.
- Plans for everyone.
- More than 50 channels.
- A wide selection of movies and series.
- Children's entertainment.
- Free exclusive channels like DSports, Dnews, and Dfight.
Where to Watch
Stream on your smartphone, tablet, computer, or smart TV. Download the DGO app and enjoy the best of live TV and streaming, anytime, anywhere, on up to 4 devices simultaneously.
How to Get DGO
Subscribe on the DGO website, choose or customize your plan, or access it through our partners.
Help Section
Need assistance? Explore our FAQs or chat with us directly—we're here to help!
Comparable Android apps
The five apps in Entertainment with the closest revenue to DGO. Click any to see its detail page.
Each forecast combines App Store rating, ratings count, monetisation model, pricing tier, IAP signals and ad-supported flag.
The base estimate is then multiplied by a per-category scaling factor learned from apps with founder-verified MRR.
Every number on this page comes from public APIs and bumetric's own snapshot history.
Full methodology covers input variables, accuracy bands per category and how we treat apps without comparable anchors.
See also the live data on DGO's tracker page for current rating, reviews and snapshot timeline.
Building something similar? Get a free AI audit with $-revenue forecasts for every recommendation.

 Pocket Money: Rewards Everyday
 Dark Goddess Tarot
 MEGOGO: Live TV & movies
 JBL Portable
 Sun NXT