ML revenue forecast.
Calibrated against 26282 apps in this category.
Confidence band
±15%
High — many comparable apps with verified data
At a glance
Tracks close to the Android app category median (173/mo).
Ranks #9,236 of 26,282 in Casual (top 35.1% by revenue).
Launched Mar 19, 2012 · last updated Dec 04, 2025.
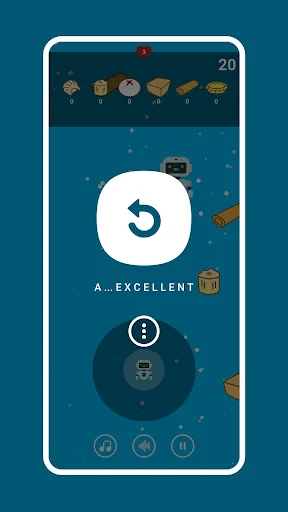
What the app looks like
Live screenshots from the Play Store, captured by our snapshot worker. Tap any image to enlarge.
Dim Sum's revenue trajectory
Forecast revenue from snapshot history. Last 1 months.
Where Dim Sum sits in Casual
Revenue distribution of 26282 comparable apps. Dim Sum highlighted.
Dim Sum vs comparable apps
Revenue trajectory side-by-side. Bold = Dim Sum, ghosted = peers.
App spec
Version
8.1.0
Last update
Dec 04, 2025
Launched
Mar 19, 2012
Price
Free
Monetization
Free
What Dim Sum actually does (from store listing)
:p Steamed shrimp dumpling
:p Siu mai
:p Barbecued pork bun
:p Cantonese sponge cake
:p Spring roll
:p Egg Tart
:p Sesame paste bun
:p Steamed rice noodle roll
:p Glutinous rice chicken
:p Osmanthus cake
All of above and many more are typical food served in dim sum restaurant. They are delicate, delicious, and delightful!
Players control a robot to rush through orders, leveling up after clearing all items to zero. With five levels in total, aim for the 5A rating to earn …
:p Steamed shrimp dumpling
:p Siu mai
:p Barbecued pork bun
:p Cantonese sponge cake
:p Spring roll
:p Egg Tart
:p Sesame paste bun
:p Steamed rice noodle roll
:p Glutinous rice chicken
:p Osmanthus cake
All of above and many more are typical food served in dim sum restaurant. They are delicate, delicious, and delightful!
Players control a robot to rush through orders, leveling up after clearing all items to zero. With five levels in total, aim for the 5A rating to earn a little surprise!
Enjoy!
Comparable Android apps
The five apps in Casual with the closest revenue to Dim Sum. Click any to see its detail page.
Each forecast combines App Store rating, ratings count, monetisation model, pricing tier, IAP signals and ad-supported flag.
The base estimate is then multiplied by a per-category scaling factor learned from apps with founder-verified MRR.
Every number on this page comes from public APIs and bumetric's own snapshot history.
Full methodology covers input variables, accuracy bands per category and how we treat apps without comparable anchors.
See also the live data on Dim Sum's tracker page for current rating, reviews and snapshot timeline.
Building something similar? Get a free AI audit with $-revenue forecasts for every recommendation.


 Truth or Dare Questions
 Blend It Perfect 3D
 Farm Simulator– Milk & Harvest
 public bus
 霊感/診断
霊感/診断