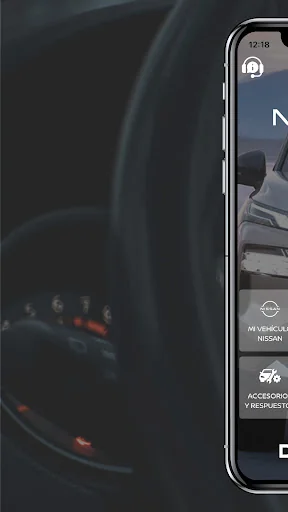
Our Dinissan app for smartphones and tablets is designed to bring and facilitate the interaction of current and future Nissan customers with our brand.
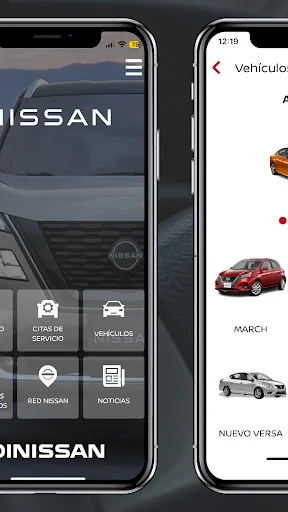
We have 6 main sections that are:
1. My Nissan: Where the client can take the resume of different aspects related to services, benefits and legal issues of the vehicle, that is, store important dates of preventive maintenance reviews, SOAT, mechanical technical review, insurance all risk and oil changes among others, verify benefits to whic…
Our Dinissan app for smartphones and tablets is designed to bring and facilitate the interaction of current and future Nissan customers with our brand.
We have 6 main sections that are:
1. My Nissan: Where the client can take the resume of different aspects related to services, benefits and legal issues of the vehicle, that is, store important dates of preventive maintenance reviews, SOAT, mechanical technical review, insurance all risk and oil changes among others, verify benefits to which you are entitled in services, know what is the monthly expenditure on gasoline of your vehicle, update information.
2. Maintenance: Developed to schedule a quick and easy appointment with the Service Center.
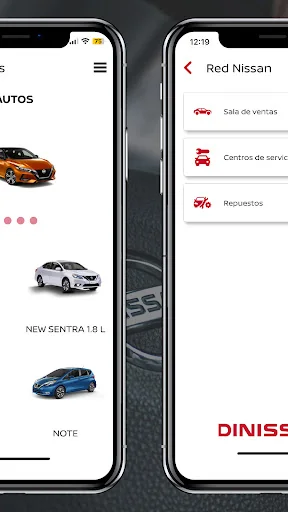
3. Vehicles: Virtual showcase with general information of each vehicle, Test Drive request and Quotations.
4. Assistance: To establish communication with our call center and insurance assistance.
5. Nissan Network: Location of sales rooms, service centers and spare parts stores nationwide. Allows you to choose by city or by nearest ones according to the client's current location.
6. News: You can find promotions, news, tips and experiences that our customers share about their Nissan.
No one besides you cares better for your Nissan than Dinissan
Comparable Android apps
The five apps in Business with the closest revenue to DINISSAN. Click any to see its detail page.
Each forecast combines App Store rating, ratings count, monetisation model, pricing tier, IAP signals and ad-supported flag.
The base estimate is then multiplied by a per-category scaling factor learned from apps with founder-verified MRR.
Every number on this page comes from public APIs and bumetric's own snapshot history.
Full methodology covers input variables, accuracy bands per category and how we treat apps without comparable anchors.
See also the live data on DINISSAN's tracker page for current rating, reviews and snapshot timeline.
Building something similar? Get a free AI audit with $-revenue forecasts for every recommendation.


 PCHUB
PCHUB
 OpenManage Mobile
 ActiveCampaign
 Linked Phone Business Number
 Kymdan Store