From just $4.49 per meal, Dinnerly is America's most affordable meal kit! It's also fast, convenient, picky eater-proof, and totally delicious. Use our app to choose your recipes, schedule delivery days, and save a whole lot of time.
Dinnerly replaces tedious meal planning and grocery shopping with tasty, easy-to-make recipes and pre-portioned ingredients delivered direct to your door. There are 14 unique recipe options every week, so even your pickiest eaters will be happy!
Here's more…
From just $4.49 per meal, Dinnerly is America's most affordable meal kit! It's also fast, convenient, picky eater-proof, and totally delicious. Use our app to choose your recipes, schedule delivery days, and save a whole lot of time.
Dinnerly replaces tedious meal planning and grocery shopping with tasty, easy-to-make recipes and pre-portioned ingredients delivered direct to your door. There are 14 unique recipe options every week, so even your pickiest eaters will be happy!
Here's more of what you can do with the app:
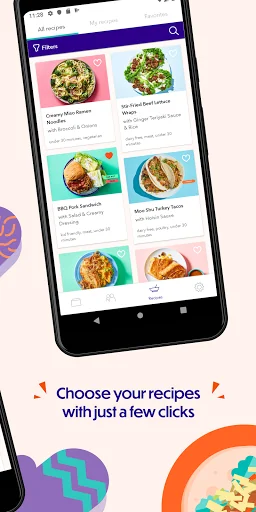
- Pick your meal plan: decide what, when, and how much to cook.
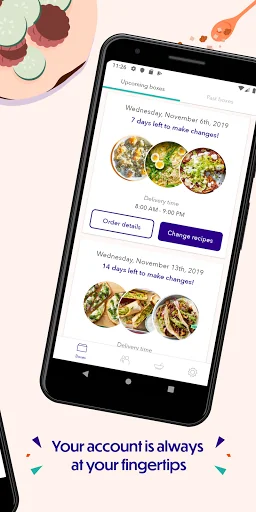
- Choose recipes and delivery days up to 8 weeks in advance.
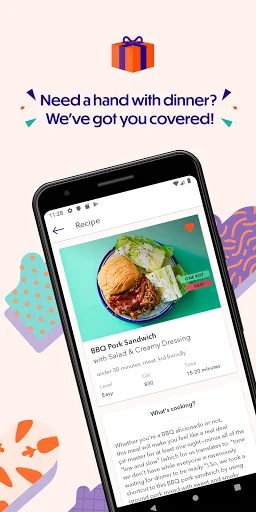
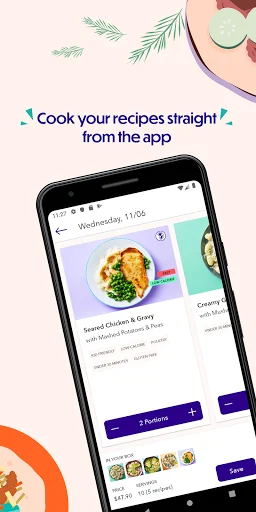
- Cook with easy-to-follow digital recipes.
- Rate your dinners and give our chefs feedback.
- Save your favorite recipes.
- Send free cooking boxes to your friends.
Like a magical food fairy, Dinnerly makes weeknight cooking—and life, in general—a whole lot easier. Our home cooking kit's weekly collection of 14 unique recipes has something for everyone. Healthy? Vegetarian? Family-friendly? We've got you covered. Download the app to start cooking with Dinnerly tonight!
Need more meal it info? Visit our website: https://dinnerly.com/how
Like us on Facebook and get smart cooking hacks: facebook.com/dinnerly
See what's cooking on our Instagram page: instagram.com/dinnerly
Comparable Android apps
The five apps in Food & Drink with the closest revenue to Dinnerly. Click any to see its detail page.
Each forecast combines App Store rating, ratings count, monetisation model, pricing tier, IAP signals and ad-supported flag.
The base estimate is then multiplied by a per-category scaling factor learned from apps with founder-verified MRR.
Every number on this page comes from public APIs and bumetric's own snapshot history.
Full methodology covers input variables, accuracy bands per category and how we treat apps without comparable anchors.
See also the live data on Dinnerly's tracker page for current rating, reviews and snapshot timeline.
Building something similar? Get a free AI audit with $-revenue forecasts for every recommendation.

 Texas Chicken
 Рецепты на каждый день
 Tcheco Lanches
 Balance Grille App
 Sushi and roll recipes