What Display Tester actually does (from store listing)
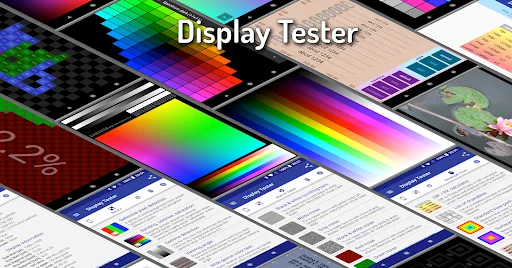
DisplayTester makes it possible to test almost every aspect of your device's LCD/OLED screen. Using Google Cast it is possible to test the display quality of your TV. It is designed to allow full screen testing also on devices with soft keys (hiding the soft keys in ICS and later, immersive mode in KitKat and later).
-----
-= Free features =-
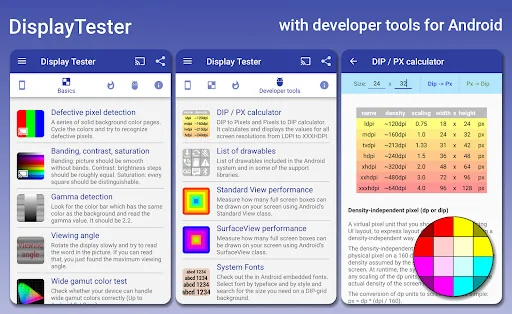
◆ Dead pixel test: detect "dead pixels" by displaying a series of solid background color pages
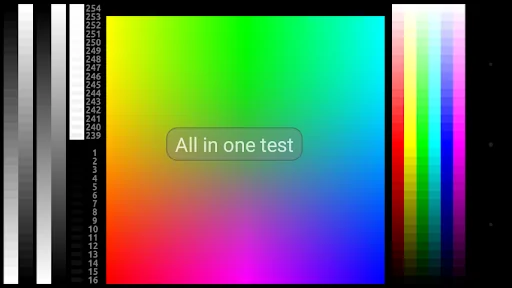
◆ Color tests: contrast, gradient (banding) and satu…
DisplayTester makes it possible to test almost every aspect of your device's LCD/OLED screen. Using Google Cast it is possible to test the display quality of your TV. It is designed to allow full screen testing also on devices with soft keys (hiding the soft keys in ICS and later, immersive mode in KitKat and later).
-----
-= Free features =-
◆ Dead pixel test: detect "dead pixels" by displaying a series of solid background color pages
◆ Color tests: contrast, gradient (banding) and saturation tests
◆ Gamma calibration tests (grey/red/green/blue)
◆ Viewing angle tests (This is useless for OLED displays)
◆ Wide gamut color test
◆ Multi-touch test
◆ Display performance tests
◆ Repair burn in - scrolling black & white bars
◆ Display measures info: screen size, GPU type, dpi, density-independent pixel size, OpenGL 1.x info, pixel format
◆ Real world pictures for reference and comparison
◆ 4-color gradient test with orientation change correction (Android 2.2 and higher)
◆ Pixel format & dithering tests
◆ Built-in font styles test
◆ Manually DPI measurement
◆ Color charts
◆ Touch screen dead spot tester
◆ System Fonts tester
◆ DIP / PX calculator
-= Pro features =-
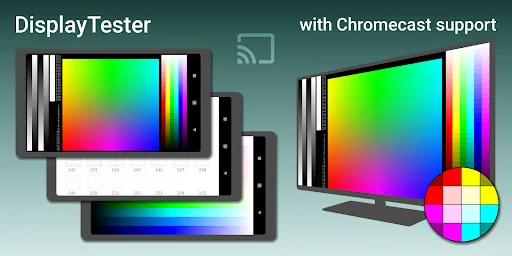
◆ Full Google Cast support
◆ Repair burn in - noise (white, b&w, red, green, blue)
-= Soft key hiding in ICS/Honeycomb/JellyBean =-
Use the preferences menu option for this or simply long touch the display during a test is running.
-= Gestures =-
◆ Slide left-right: change test image
◆ Slide up-down: change brightness
◆ Long touch: switch between full screen and normal screen (Android 3.0 and higher)
◆ Double tap: hide or show the test specific settings dialogue (if available)
When the soft keys are hidden it is not easy to advance to the next screen: First tap to make the buttons appear, then a quick swipe for the next screen before the buttons are hidden again.
-----
Please consider purchasing the Pro version to support further development.
If you are having a problem or you have a suggestion about a missing feature, the ONLY way it will get done is if you email me! :)
Comparable Android apps
The five apps in Tools with the closest revenue to Display Tester. Click any to see its detail page.
Each forecast combines App Store rating, ratings count, monetisation model, pricing tier, IAP signals and ad-supported flag.
The base estimate is then multiplied by a per-category scaling factor learned from apps with founder-verified MRR.
Every number on this page comes from public APIs and bumetric's own snapshot history.
Full methodology covers input variables, accuracy bands per category and how we treat apps without comparable anchors.
See also the live data on Display Tester's tracker page for current rating, reviews and snapshot timeline.
Building something similar? Get a free AI audit with $-revenue forecasts for every recommendation.

 TIKI
TIKI
 Smart Level
 Galaxy Buds Manager
 Sound Meter
 File Manager