What DiveHunter actually does (from store listing)
DiveHunter is enriched with new features!
Now you can swim on the surface and be able to look at the marine environment from above to choose the hunting area!
We have also enriched the seabed and improved the AI (Artificial Intelligence) and the fish graphics.
Very soon many new and exciting news!
Want to know one? You will be able to choose and use new accessories for your spearfishing!
DiveHunter, the new mobile game dedicated to spearfishing enthusiasts is now ready for you!
Born from…
DiveHunter is enriched with new features!
Now you can swim on the surface and be able to look at the marine environment from above to choose the hunting area!
We have also enriched the seabed and improved the AI (Artificial Intelligence) and the fish graphics.
Very soon many new and exciting news!
Want to know one? You will be able to choose and use new accessories for your spearfishing!
DiveHunter, the new mobile game dedicated to spearfishing enthusiasts is now ready for you!
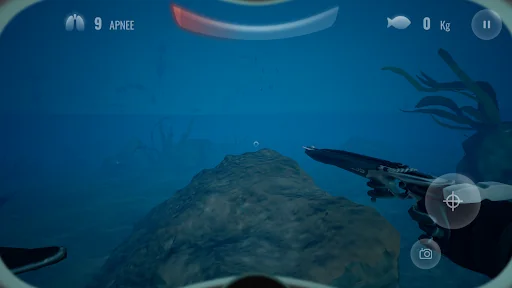
Born from the idea of an estimator and fishing enthusiast, DiveHunter was conceived and created to be a full-fledged simulator, without neglecting the playful aspect, for a new and engaging entertainment.
Test your marine hunting skills in total apnea! You have 30 to 40 seconds of oxygen available to prey on and catch your fish with your inseparable rifle: the more fish you capture the more seconds of time you gain.
The game includes a game of 10 apneas during which you will go to total your catch between the various half fish and one kg of weight.
Based on the fish catch speed and the total weight, the system will assign you a partial and total number of stars (for each apnea).
Can you do more? No problem! You can try again and have fun with DiveHunter as many times as you want.
Comparable Android apps
The five apps in Simulation with the closest revenue to DiveHunter. Click any to see its detail page.
Each forecast combines App Store rating, ratings count, monetisation model, pricing tier, IAP signals and ad-supported flag.
The base estimate is then multiplied by a per-category scaling factor learned from apps with founder-verified MRR.
Every number on this page comes from public APIs and Bumetric's own snapshot history.
Full methodology covers input variables, accuracy bands per category and how we treat apps without comparable anchors.
See also the live data on DiveHunter's tracker page for current rating, reviews and snapshot timeline.
Building something similar? Get a free AI audit with $-revenue forecasts for every recommendation.



 Hyper Pets Fun Runner Endless
 Woorimal Merge
 Air War
 Plane Pilot Flight Simulator
 Chat Master Academy