1.2M Assets Tracked Updated 2 min ago Revenue Forecasts
Add an app Create Account Sign In
Home
DNVCollect icon

How much does DNVCollect earn?

Android app from District of North Vancouver · Productivity

ML forecast ★ 4.4 · 465 Free

~345/mo

ML revenue forecast. Calibrated against 35236 apps in this category.

Confidence band
±15%
High — many comparable apps with verified data

At a glance

What the app looks like

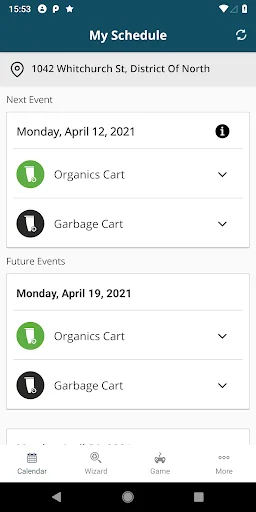
Live screenshots from the Play Store, captured by our snapshot worker. Tap any image to enlarge.

DNVCollect screenshot 1 DNVCollect screenshot 2 DNVCollect screenshot 3 DNVCollect screenshot 4

DNVCollect's revenue trajectory

Forecast revenue from snapshot history. Last 1 months.

Where DNVCollect sits in Productivity

Revenue distribution of 35236 comparable apps. DNVCollect highlighted.

DNVCollect vs comparable apps

Revenue trajectory side-by-side. Bold = DNVCollect, ghosted = peers.

App spec

Version
2026.3.10
Last update
Mar 10, 2026
Launched
Dec 21, 2015
Price
Free
Monetization
Free

What DNVCollect actually does (from store listing)

Recycling, green can and garbage schedules and reminders for District of North Vancouver. View your garbage and recycling schedule and receive collection notifications all from within this app.

Comparable Android apps

The five apps in Productivity with the closest revenue to DNVCollect. Click any to see its detail page.

AppRevenueRatingRatings
AC Calculator - HVAC Sizing icon AC Calculator - HVAC Sizing 345 ★ 4.0 401
PSA Garantias icon PSA Garantias 345 0
uVPN - Fast Secure VPN Proxy icon uVPN - Fast Secure VPN Proxy 345 ★ 3.8 3K
Tasbeeh Counter (Save Option) icon Tasbeeh Counter (Save Option) 345 ★ 4.8 528
Super Amazing FlashLight HD icon Super Amazing FlashLight HD 345 ★ 4.7 2K
Own DNVCollect? Replace our estimate with your real revenue via Stripe Connect or ASC. Get a public Verified badge.
Claim & verify →

How we calculated this

Each forecast combines App Store rating, ratings count, monetisation model, pricing tier, IAP signals and ad-supported flag. The base estimate is then multiplied by a per-category scaling factor learned from apps with founder-verified MRR. Every number on this page comes from public APIs and bumetric's own snapshot history.

Full methodology covers input variables, accuracy bands per category and how we treat apps without comparable anchors. See also the live data on DNVCollect's tracker page for current rating, reviews and snapshot timeline.

Building something similar? Get a free AI audit with $-revenue forecasts for every recommendation.
Audit my app →