ML revenue forecast.
Calibrated against 27694 apps in this category.
Confidence band
±15%
High — many comparable apps with verified data
At a glance
Earns 1.61× more than the category median (149/mo).
Ranks #6,310 of 27,694 in Arcade (top 22.8% by revenue).
Launched Oct 16, 2020 · last updated Feb 01, 2022.
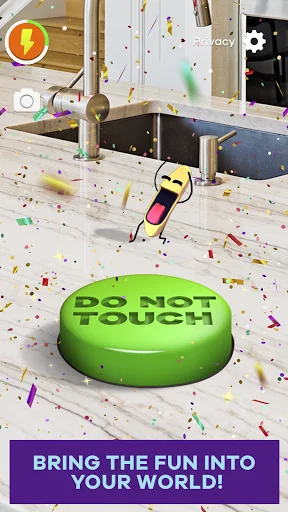
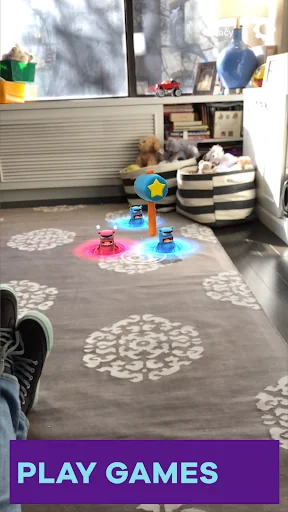
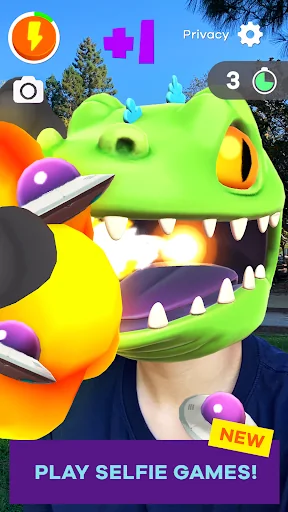
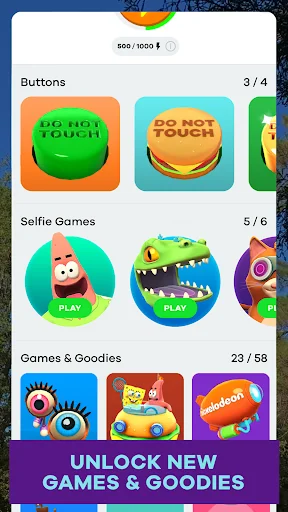
What the app looks like
Live screenshots from the Play Store, captured by our snapshot worker. Tap any image to enlarge.
Do Not Touch's revenue trajectory
Forecast revenue from snapshot history. Last 1 months.
Where Do Not Touch sits in Arcade
Revenue distribution of 27694 comparable apps. Do Not Touch highlighted.
Do Not Touch vs comparable apps
Revenue trajectory side-by-side. Bold = Do Not Touch, ghosted = peers.
App spec
Version
3.1.0
Last update
Feb 01, 2022
Launched
Oct 16, 2020
Price
Free
Monetization
Free
What Do Not Touch actually does (from store listing)
Are you ready for a whole new Augmented Reality (AR) experience? Bring the wild world of Nickelodeon's Do Not Touch button straight into your own 3D, real-world space! Play with SpongeBob in your kitchen, enter a portal into outer space from your living room, dig for buried treasure under your bedroom floor, and even breathe fire as Reptar! Get high scores to unlock rare buttons, games, and goodies – think you’ve got what it takes to collect them all?
Getting started is easy.
1) Point your c…
Are you ready for a whole new Augmented Reality (AR) experience? Bring the wild world of Nickelodeon's Do Not Touch button straight into your own 3D, real-world space! Play with SpongeBob in your kitchen, enter a portal into outer space from your living room, dig for buried treasure under your bedroom floor, and even breathe fire as Reptar! Get high scores to unlock rare buttons, games, and goodies – think you’ve got what it takes to collect them all?
Getting started is easy.
1) Point your camera at a flat, well-lit surface
2) See the ‘Do Not Touch’ button appear in your space. Then...press the button!
3) Move your phone or tablet around the room to see all of the action directly on the screen
Features include:
• Augmented reality games!
• Interactive selfie games!
• All games are safe for kids, and images stay on your device and don’t get shared with anyone or anywhere.
• Cool (and completely crazy!) animated goodies!
• Customizable, themed buttons!
• New stuff added all the time!
• Your favorite Nickelodeon characters & shows like SpongeBob, The Loud House, and more!
• Interactive mini games - tap, move around, or get closer to see the fun up close!
• Play anywhere (but always make sure you’re in a safe place to play)
Games & Goodies include:
• SpongeBob Jellyfishing
• The Loud House pop & drop
• Whack-a-Monster
• Whoopee cushions
• Reptar Earth Defense
• Space Portal
• Fridge Party
• Double Dare: The Nose
• Toe Forest
• Lava Dig
• Scuba Cat
• Ghost Detector
• Nickelodeon Blimp
• Slime
• And many more!
The Do Not Touch app collects personal user data as well as non-personal user data (including aggregated data). User data collection is in accordance with applicable law, such as COPPA. User data may be used, for example, to respond to user requests; enable users to take advantage of certain features and services; personalize content and advertising; and manage and improve Nickelodeon's services. For more information regarding Nickelodeon’s use of personal user data, please visit the Nickelodeon Group Privacy Policy below. Our Privacy Policy is in addition to any terms, conditions or policies agreed to between you and Google, Inc., and Nickelodeon and its affiliated entities are not responsible for Google's collection or use of your personal user data and information. Additionally, this App may use “local notifications.” Local notifications are sent directly from the App to your device (you don’t need to be connected to the Internet) and may be used to notify you of new content or events within your App, among other reasons. Use of this app is subject to the Nickelodeon End User License Agreement.
For users residing in the EU, The Do Not Touch app may include the use of persistent identifiers for game management purposes and installation of this app constitutes your permission to such usage of persistent identifiers for all users on your device.
The Do Not Touch app may contain advertising.
Terms of Use: https://mobilefiles.nick.com/terms-of-use.htm
Each forecast combines App Store rating, ratings count, monetisation model, pricing tier, IAP signals and ad-supported flag.
The base estimate is then multiplied by a per-category scaling factor learned from apps with founder-verified MRR.
Every number on this page comes from public APIs and bumetric's own snapshot history.
Full methodology covers input variables, accuracy bands per category and how we treat apps without comparable anchors.
See also the live data on Do Not Touch's tracker page for current rating, reviews and snapshot timeline.
Building something similar? Get a free AI audit with $-revenue forecasts for every recommendation.
 Run Robot Ron
 Angry Shark Adventure Game
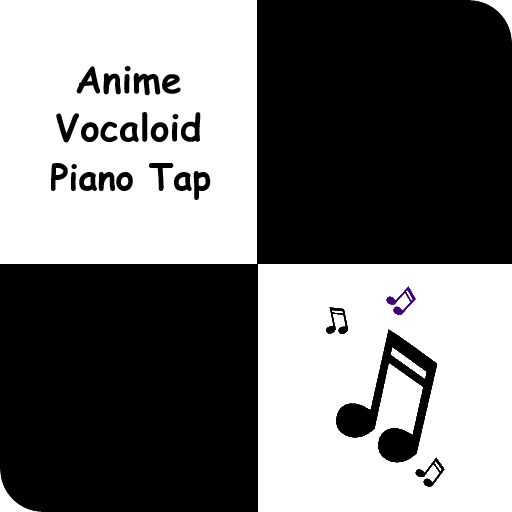 Piano Tap - Anime Vocaloid
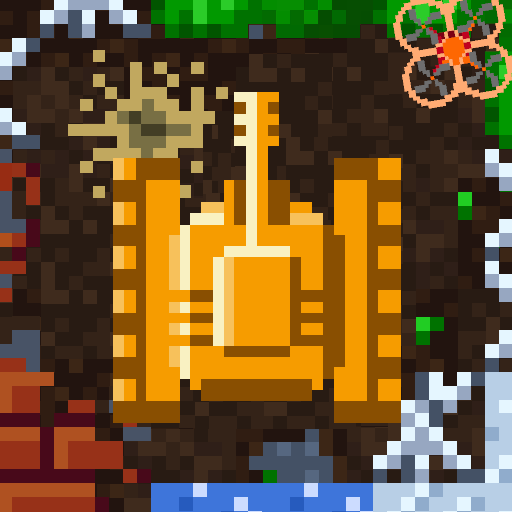 Tanks and Ships: Battle City
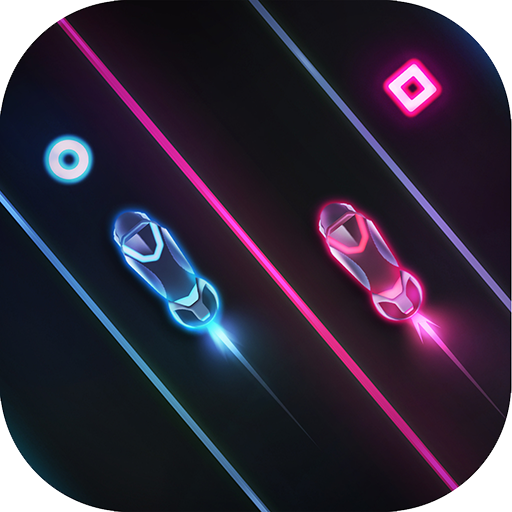 Glow 2 Cars