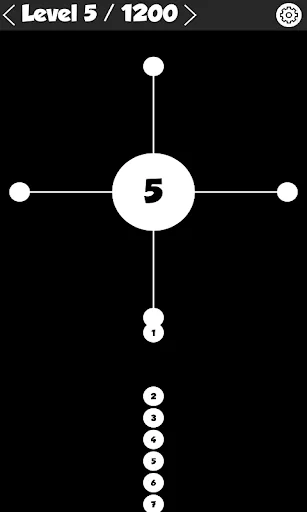
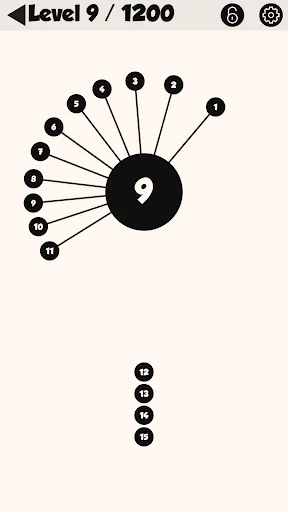
➤ Easy to play and addict to mastery. Try shooting the dots by tapping your device screen to the spinning circle. Each level brings you very interesting and the unique challenge. loads of level are awaiting for you.
💖Amazing Features of the Game💖
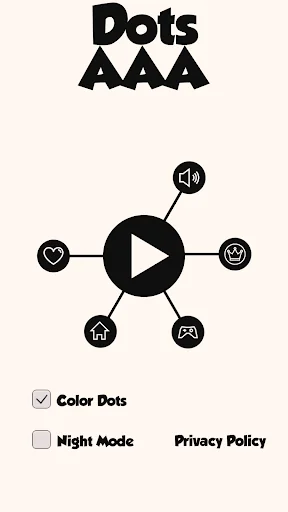
👉 Night Mode feature has been added. Now you can switch the whole game color into dark mode and light mode vice verse anytime you want.
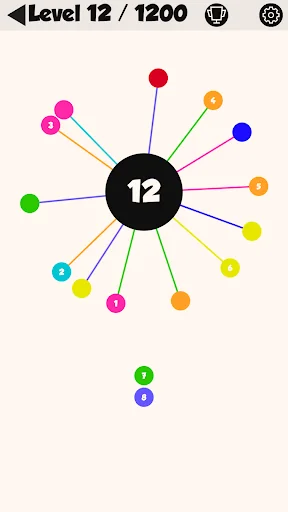
👉 Do you like colors? Introducing the Color Dots option in the game at main menu. Change the Dots color from…
➤ Easy to play and addict to mastery. Try shooting the dots by tapping your device screen to the spinning circle. Each level brings you very interesting and the unique challenge. loads of level are awaiting for you.
💖Amazing Features of the Game💖
👉 Night Mode feature has been added. Now you can switch the whole game color into dark mode and light mode vice verse anytime you want.
👉 Do you like colors? Introducing the Color Dots option in the game at main menu. Change the Dots color from theme based color to multi-color and vice versa.
👉 Unlock level button introduced. Now you can simply skip a level if it is making you trouble clearing that one by tapping unlock button on the top right side of the screen. All you need to do is to watch a short rewarded video ad, that's it.
👉 Here is the REAL DEAL! You got the more reason to play this fabulous game. Now see where does your score stands in the world. Leader-board has been introduced.
👉 Addition to the player's interest, many achievements has been added & will be adding more in future updates. Now unlock many achievements through out the game that will make your interest to the next level.
👉 Now you can make the game ads free by purchasing ads remover
👉 An attractive rating system has been added
Lets play this awesome game now
Comparable Android apps
The five apps in Strategy with the closest revenue to Dots AAA. Click any to see its detail page.
Each forecast combines App Store rating, ratings count, monetisation model, pricing tier, IAP signals and ad-supported flag.
The base estimate is then multiplied by a per-category scaling factor learned from apps with founder-verified MRR.
Every number on this page comes from public APIs and bumetric's own snapshot history.
Full methodology covers input variables, accuracy bands per category and how we treat apps without comparable anchors.
See also the live data on Dots AAA's tracker page for current rating, reviews and snapshot timeline.
Building something similar? Get a free AI audit with $-revenue forecasts for every recommendation.
 Kingdoms: Текстовая стратегия.
 Soccer Battles
 Tic Tac Toe: Two Players
 MDS Risik Lite
 OctoHits