What Drag'n'Boom actually does (from store listing)
ROOOOAAAAARRR!
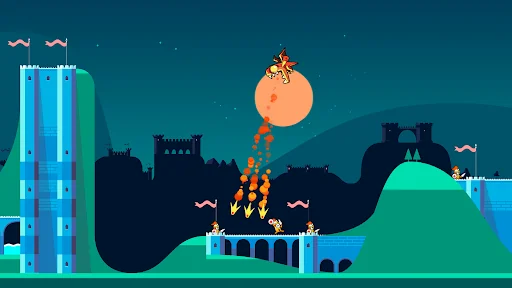
Play as a rebellious teenage DRAGON and burn everything in your path! Roast the neighboring lords and steal their gold in order to amass the greatest TREASURE ever held by a dragon.
Drag'n'Boom offers you a unique mobile gaming experience. The left side of the screen controls your movement: JUMP, FLY, and CHARGE YOUR PREY. The right side lets you spit fireballs: PILLAGE, BURN, RANSACK… and all in STYLE!
Hoard gold and unlock new powers. Launch your enemies into the air …
Play as a rebellious teenage DRAGON and burn everything in your path! Roast the neighboring lords and steal their gold in order to amass the greatest TREASURE ever held by a dragon.
Drag'n'Boom offers you a unique mobile gaming experience. The left side of the screen controls your movement: JUMP, FLY, and CHARGE YOUR PREY. The right side lets you spit fireballs: PILLAGE, BURN, RANSACK… and all in STYLE!
Hoard gold and unlock new powers. Launch your enemies into the air and perform series of combos, moves, and EXPLOSIVE ROUTINES!
Features/Characteristics
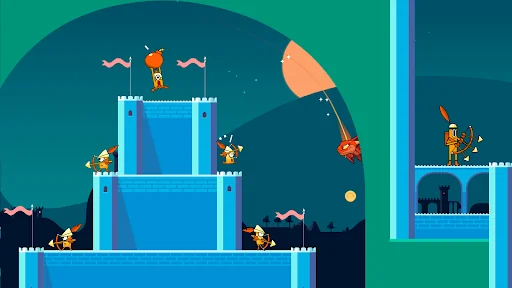
• Drag'n'Boom is a fun old-school arcade game combining speed and precision!
• Dive into an imaginary medieval universe full of heroes, echoing the greatest arcade and platform games of all time.
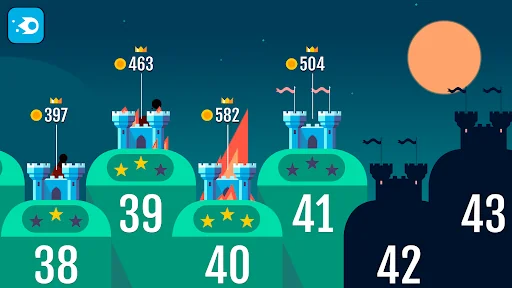
• Unleash your flames in no fewer than 50 levels and a never-ending world!
• The more gold you hoard, the more powerful you become! So what are you waiting for? For it to rain gold!
• Take advantage of these powers to strut your stuff with ever more stylish moves!
• Blow away your friends' scores with devastating combos!
• And don't forget the slow-motion effect, which allows you to shoot with extreme precision.
Comparable Android apps
The five apps in Arcade with the closest revenue to Drag'n'Boom. Click any to see its detail page.
Each forecast combines App Store rating, ratings count, monetisation model, pricing tier, IAP signals and ad-supported flag.
The base estimate is then multiplied by a per-category scaling factor learned from apps with founder-verified MRR.
Every number on this page comes from public APIs and bumetric's own snapshot history.
Full methodology covers input variables, accuracy bands per category and how we treat apps without comparable anchors.
See also the live data on Drag'n'Boom's tracker page for current rating, reviews and snapshot timeline.
Building something similar? Get a free AI audit with $-revenue forecasts for every recommendation.


 Pinatamasters
 Mmm Fingers
 HAWK: Airplane Space games
 ZENONIA® 4
 Optical Inquisitor 17+