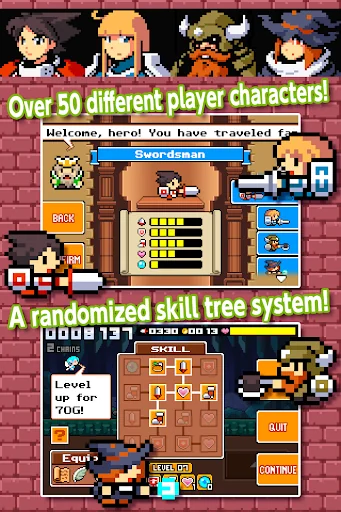
This action RPG features an amusing cast of characters and has an arcade-like feel!
Chain combos to rack up coins and level up through the skill tree!
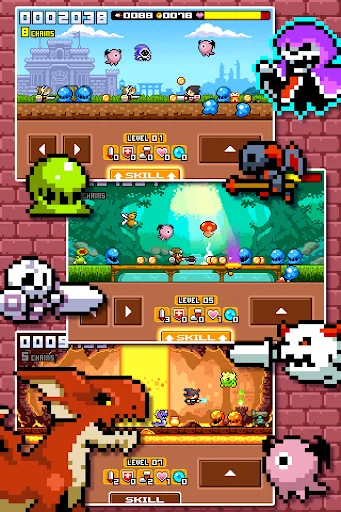
Defeat hordes of monsters and unravel the mystery of Drancia!
・Retro-style, cute pixel art graphics!
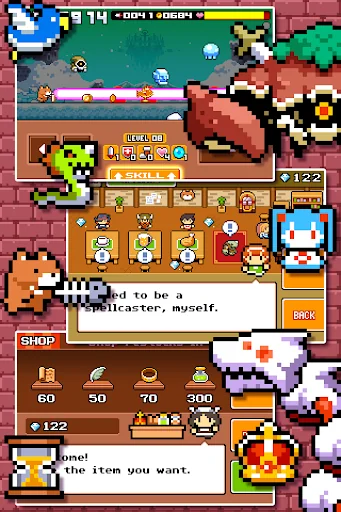
・Smooth controls and loads of extras to enjoy!
・Unique bosses in every stage!
・Over fifty different types of characters to play as!
・A killer soundtrack of over 20 vintage, Famicom-style chiptunes!
*Drancia was originally released in 20…
This action RPG features an amusing cast of characters and has an arcade-like feel!
Chain combos to rack up coins and level up through the skill tree!
Defeat hordes of monsters and unravel the mystery of Drancia!
・Retro-style, cute pixel art graphics!
・Smooth controls and loads of extras to enjoy!
・Unique bosses in every stage!
・Over fifty different types of characters to play as!
・A killer soundtrack of over 20 vintage, Famicom-style chiptunes!
*Drancia was originally released in 2008 by Skipmore as a web-based game entitled Drancia Survival. Now it’s been powered-up for smartphones!
Art, sound, and game design: SKIPMORE
Programming: URARA-WORKS Co., Ltd.
Translation: NEP
Comparable Android apps
The five apps in Action with the closest revenue to Drancia. Click any to see its detail page.
Each forecast combines App Store rating, ratings count, monetisation model, pricing tier, IAP signals and ad-supported flag.
The base estimate is then multiplied by a per-category scaling factor learned from apps with founder-verified MRR.
Every number on this page comes from public APIs and bumetric's own snapshot history.
Full methodology covers input variables, accuracy bands per category and how we treat apps without comparable anchors.
See also the live data on Drancia's tracker page for current rating, reviews and snapshot timeline.
Building something similar? Get a free AI audit with $-revenue forecasts for every recommendation.

 Zombies Frontier Dead Killer
 Gunship War : Helicopter Games
 Critical Terrorist Strike Game
 Tank Warfare: PvP Tanks Blitz
 BioBeasts: Mutate & Destroy