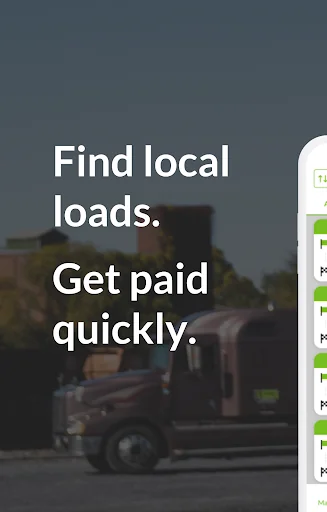
Find local intermodal loads that are right for you, make it home every night, and get paid out every Wednesday - <b>No kidding.</b>
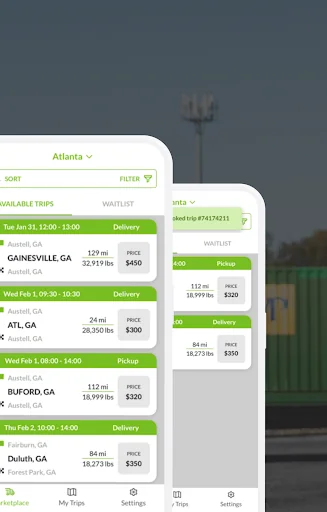
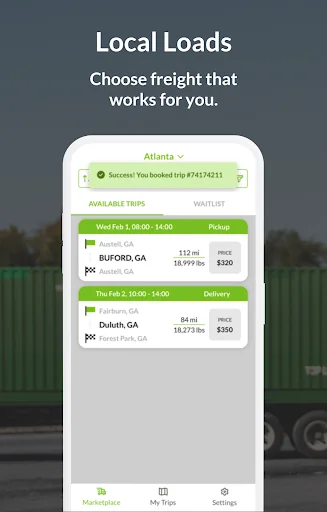
DrayNow’s free Intermodal Freight Marketplace App connects Owner Operator Carriers who have their own Interstate Authority with local power only intermodal loads. Every load has complete up-front pricing and detailed instructions, so you can save time and find the loads that work for you.
All Local Loads
These short-haul freight lanes are typically 250 miles…
Find local intermodal loads that are right for you, make it home every night, and get paid out every Wednesday - No kidding.
DrayNow’s free Intermodal Freight Marketplace App connects Owner Operator Carriers who have their own Interstate Authority with local power only intermodal loads. Every load has complete up-front pricing and detailed instructions, so you can save time and find the loads that work for you.
All Local Loads
These short-haul freight lanes are typically 250 miles or less, so you make it home every night. That means not only do you save money on fuel, boosting your profits, but you also save big by avoiding the increasingly high costs of living over the road.
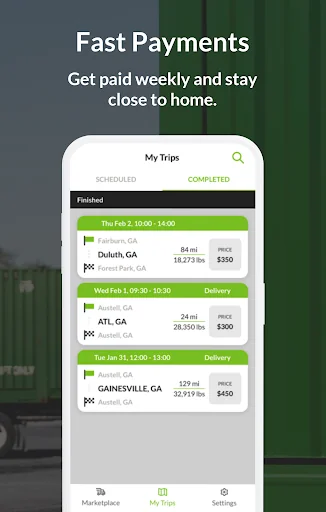
Weekly Payouts Get paid every Wednesday. Loads completed Sunday-Saturday are paid out and settled the following Wednesday. Because helping our carriers stay on the road is our #1 priority.
Grow Your Business Whether you’re managing a one-person trucking operation, a family business, or a growing independent fleet, DrayNow’s Intermodal Freight Marketplace App is equipped to help you manage and scale your transportation business. Add additional driver and dispatcher accounts to delegate your operations while maintaining tight control over who can see pricing and tender loads.
Ready to begin? Download the DrayNow app to begin the registration process. Or if you still need more info here are some helpful links with more information about the DrayNow Intermodal Freight Marketplace:
DrayNow Carrier Video Resources - https://draynow.com/carrier-video-library/
DrayNow will use your location when you have a Trip in progress, even when the app is closed. This makes is it easy to track things like appointment arrivals, detention, and ETAs automatically so you can focus on driving, and leave the details to us.
Additional questions? Reach out to our Carrier Success Team:
DrayNow Carrier Success Team
Truck@DrayNow.com
833-562-3277
Comparable Android apps
The five apps in Maps & Navigation with the closest revenue to DrayNow. Click any to see its detail page.
Each forecast combines App Store rating, ratings count, monetisation model, pricing tier, IAP signals and ad-supported flag.
The base estimate is then multiplied by a per-category scaling factor learned from apps with founder-verified MRR.
Every number on this page comes from public APIs and bumetric's own snapshot history.
Full methodology covers input variables, accuracy bands per category and how we treat apps without comparable anchors.
See also the live data on DrayNow's tracker page for current rating, reviews and snapshot timeline.
Building something similar? Get a free AI audit with $-revenue forecasts for every recommendation.


 Integrated Video
 Taxi Pan
 ridermo
 FourKites
 화순버스 스마트