What Drew & Cole actually does (from store listing)
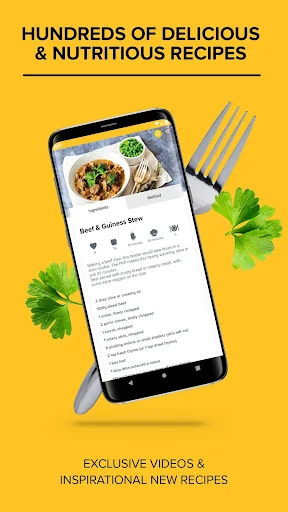
100s of delicious and nutritious recipes – whatever your dietary requirement – with instructional videos, handy hacks and plenty of inspiration! The Drew & Cole App is easy to use and updated with exclusive recipes and videos helping you make the most of your mealtimes.
- 100s of delicious, easy to make recipes
- Recipe Videos with step by step instructions
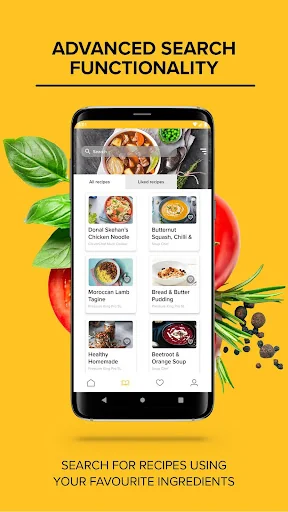
- Advanced Search Functionality
- Regular exclusive recipes and fresh content
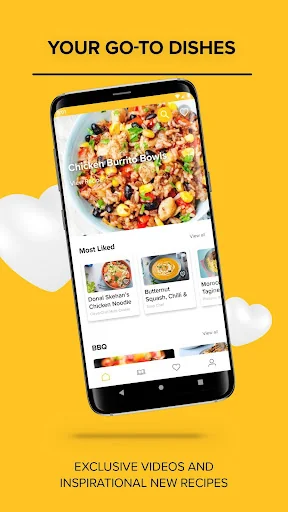
- Like function to save your go-to most loved r…
100s of delicious and nutritious recipes – whatever your dietary requirement – with instructional videos, handy hacks and plenty of inspiration! The Drew & Cole App is easy to use and updated with exclusive recipes and videos helping you make the most of your mealtimes.
- 100s of delicious, easy to make recipes
- Recipe Videos with step by step instructions
- Advanced Search Functionality
- Regular exclusive recipes and fresh content
- Like function to save your go-to most loved recipes
- Share your cooking creations with your friends and followers
Comparable Android apps
The five apps in Food & Drink with the closest revenue to Drew & Cole. Click any to see its detail page.
Each forecast combines App Store rating, ratings count, monetisation model, pricing tier, IAP signals and ad-supported flag.
The base estimate is then multiplied by a per-category scaling factor learned from apps with founder-verified MRR.
Every number on this page comes from public APIs and bumetric's own snapshot history.
Full methodology covers input variables, accuracy bands per category and how we treat apps without comparable anchors.
See also the live data on Drew & Cole's tracker page for current rating, reviews and snapshot timeline.
Building something similar? Get a free AI audit with $-revenue forecasts for every recommendation.


 Aroma Joe's
 Happy Group
 Coffee Culture
 Fast Food Recipes In Urdu
 Smartcave