What Drive Axle actually does (from store listing)
Easiest Mobile Document Scanning App for Truckers
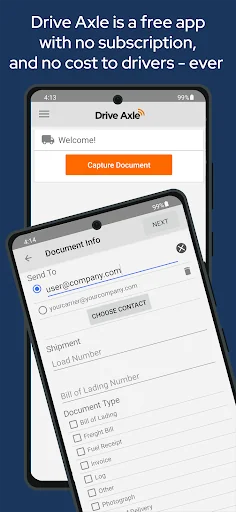
Get paid faster by using the most convenient and easy document scanning app for truck drivers. No subscriptions or fees, forever.
With Drive Axle, you’ll enjoy…
Getting paid faster - Our users report that the ease of use for Drive Axle comes in helping them get paid faster. Drive Axle scans have fewer issues getting drivers approved for pay faster.
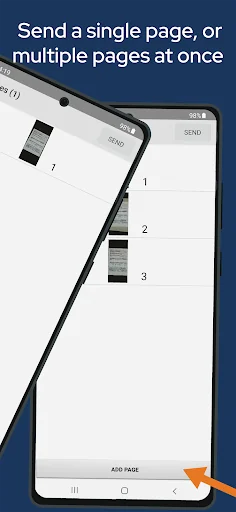
It is Convenient and easy - Simply scan and send your documents. That’s it. Send one o…
Get paid faster by using the most convenient and easy document scanning app for truck drivers. No subscriptions or fees, forever.
With Drive Axle, you’ll enjoy…
Getting paid faster - Our users report that the ease of use for Drive Axle comes in helping them get paid faster. Drive Axle scans have fewer issues getting drivers approved for pay faster.
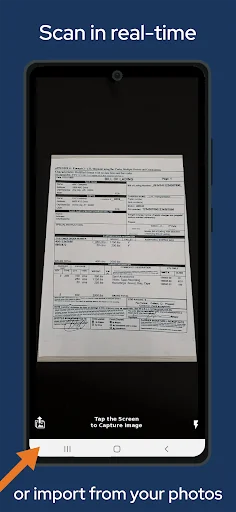
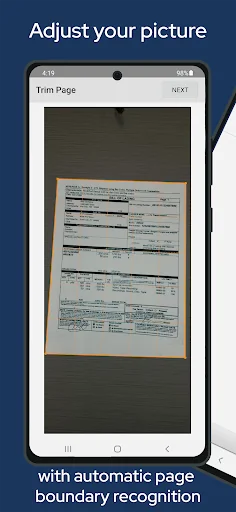
It is Convenient and easy - Simply scan and send your documents. That’s it. Send one or or more pages at once to any email address necessary. Our image enhancement helps improve scan quality in all conditions so there’s less back and forth from the carrier.
Easy Document Management - Drive Axle keeps track of all of the documents you send and who you sent them to. No need to keep stacks of papers any more.
No subscriptions - Drive Axle is a free app with no hidden fees, and no cost to drivers. We don't limit your document scans, or put any features behind a paywall.
* The makers of Drive Axle make no guarantee that any fleet will receive and accept documents transmitted from this app. In order to protect against abuse and ensure fast document delivery, high volume document recipients may be subject to restriction.
For questions or help, please visit our Frequently Asked Questions: https://www.driveaxleapp.com/faq
Comparable Android apps
The five apps in Business with the closest revenue to Drive Axle. Click any to see its detail page.
Each forecast combines App Store rating, ratings count, monetisation model, pricing tier, IAP signals and ad-supported flag.
The base estimate is then multiplied by a per-category scaling factor learned from apps with founder-verified MRR.
Every number on this page comes from public APIs and bumetric's own snapshot history.
Full methodology covers input variables, accuracy bands per category and how we treat apps without comparable anchors.
See also the live data on Drive Axle's tracker page for current rating, reviews and snapshot timeline.
Building something similar? Get a free AI audit with $-revenue forecasts for every recommendation.

 Brighton Real Estate
 HGS ESS
 Kahramaa
 AI Website Generator Appy Pie
 Insightly CRM