What Drivers Cam actually does (from store listing)
Get prepared to local difficulties in your practical driving test exam with Drivers Cam.
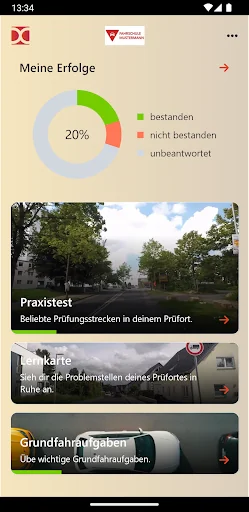
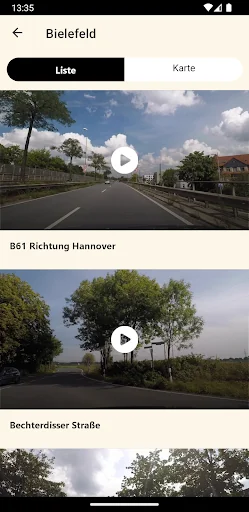
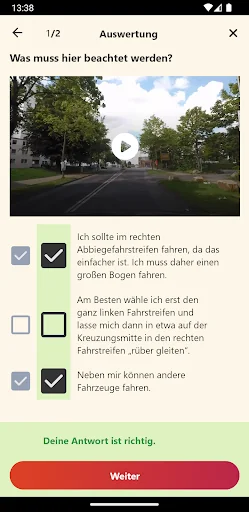
Drivers Cam provides you with preparation exams available in your Drivers Cam Student Account for offline and mobile use. You can download single tests as you need to your smartphone or tablet and use them anywhere and anytime - at home or on your way.
All Drivers Cam features:
- Sign in your existing Drivers Cam account (received from your driving school)
- Download only tests currently needed fro…
Get prepared to local difficulties in your practical driving test exam with Drivers Cam.
Drivers Cam provides you with preparation exams available in your Drivers Cam Student Account for offline and mobile use. You can download single tests as you need to your smartphone or tablet and use them anywhere and anytime - at home or on your way.
All Drivers Cam features:
- Sign in your existing Drivers Cam account (received from your driving school)
- Download only tests currently needed from your exam region
- Download all exams for offline use (no permanent network connection required)
- Practice every exam as often as you like
- Exam results saved locally in the app
- Sync of exam results with your Drivers Cam online account (with existing network connection)
- Playlist with all Drivers Cam videos of your exam region
You need a Drivers Cam student account for using Drivers Cam. Please contact your driving school to request your login information.
Comparable Android apps
The five apps in Education with the closest revenue to Drivers Cam. Click any to see its detail page.
Each forecast combines App Store rating, ratings count, monetisation model, pricing tier, IAP signals and ad-supported flag.
The base estimate is then multiplied by a per-category scaling factor learned from apps with founder-verified MRR.
Every number on this page comes from public APIs and bumetric's own snapshot history.
Full methodology covers input variables, accuracy bands per category and how we treat apps without comparable anchors.
See also the live data on Drivers Cam's tracker page for current rating, reviews and snapshot timeline.
Building something similar? Get a free AI audit with $-revenue forecasts for every recommendation.

 Learn French Language Offline
 Escola de Música Virtual
 Dytective para la dislexia
 Nextlingua - Learn Languages
 চাকরির আপডেট-Job Updates (WB)