Live screenshots from the Play Store, captured by our snapshot worker. Tap any image to enlarge.
On Dropout, stream exclusive shows, watch behind-the-scenes footage, and support a fully independent comedy channel.
WHAT’S ON IT?
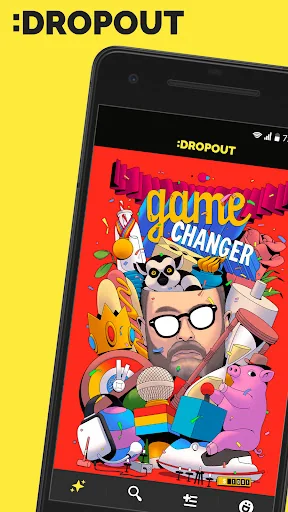
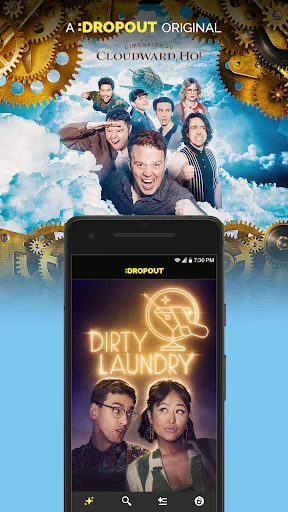
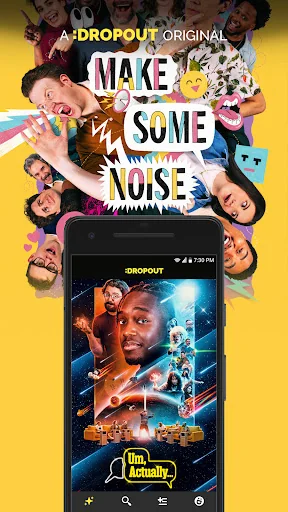
-New original series like Dimension 20, Game Changer, Um Actually, Breaking News, What the F 101, Ultramechatron Team Go, Bad Internet, and more.
-Exclusive content you won't find anywhere else - all uncensored and ad-free - with talent like Brennan Lee Mulligan, Sam Reich, Zac Oyama, Emily Axford, Ally Beardsley, Lou Wilson, Aabria Iyengar, Erika Ishii, and mor…
Read full description →
On Dropout, stream exclusive shows, watch behind-the-scenes footage, and support a fully independent comedy channel.
WHAT’S ON IT?
-New original series like Dimension 20, Game Changer, Um Actually, Breaking News, What the F 101, Ultramechatron Team Go, Bad Internet, and more.
-Exclusive content you won't find anywhere else - all uncensored and ad-free - with talent like Brennan Lee Mulligan, Sam Reich, Zac Oyama, Emily Axford, Ally Beardsley, Lou Wilson, Aabria Iyengar, Erika Ishii, and more.
-Weekly releases of new episodes, including Dimension 20, Adventuring Party, Game Changer, and more.
-The definitive way to browse our extensive library of the CH video content you know and love.
-The knowledge that you are supporting an independent comedy channel for the cost of one sorta okay sandwich per month.
But hey, big blocks of text are pretty boring. Instead, how about just trying Dropout for a week totally free? Download the app and sign up for a trial of 3 free-as-heck days to watch everything your eyes can handle. Cancel anytime in the 3 day trial and never be charged!
Don’t like it? I mean, we’re deeply hurt, but we understand. Cancel your membership, throw your phone in a lake, however you cope with disappointment. DO like it? Just kick back and keep watching, and your first month will automatically begin at the end of the free trial. Annual plans are also available at a discount, if you’re a money whiz. So go ahead and give it a try!
This text isn’t gonna get any more interesting. I mean, I think we’ve pretty much covered all the good stuff. Still here? Um, ok. How’s everything? Good? Cool, cool. What are you looking for? The app description is over. For real. We’re not gonna say any more stuff. Check out the free trial. It’s way better than hanging out in the Play Store this long.
Wow, you’re dedicated. Do you just love app descriptions? Weird. OK, we’re gonna go. Bye.
Terms of Service: https://watch.dropout.tv/tos
Privacy Policy: https://watch.dropout.tv/privacy
The five apps in Entertainment with the closest revenue to Dropout. Click any to see its detail page.
Each forecast combines App Store rating, ratings count, monetisation model, pricing tier, IAP signals and ad-supported flag.
The base estimate is then multiplied by a per-category scaling factor learned from apps with founder-verified MRR.
Every number on this page comes from public APIs and bumetric's own snapshot history.

 Air Horn Prank (Loud Joke)
 Call SpoofGuard
 Messages et Images d'Amour
 Spider Run 3D
 Stickers Raja Telugu Stickers