Educational Employees Credit Union (EECU) – California
The EECU mobile app allows you to access your money – anywhere, anytime. It’s fast, free and secure!
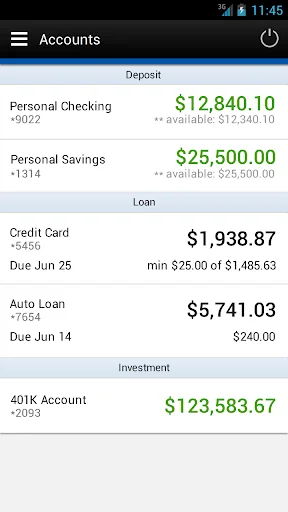
With EECU mobile banking you can:
•Check your balances
•View transaction history
•View check images
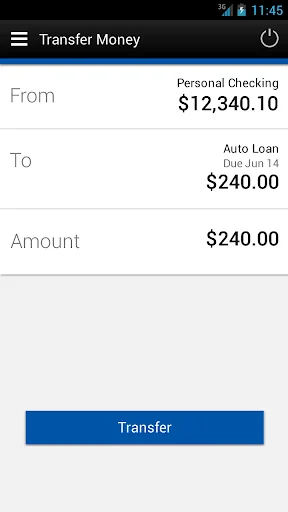
•Transfer funds
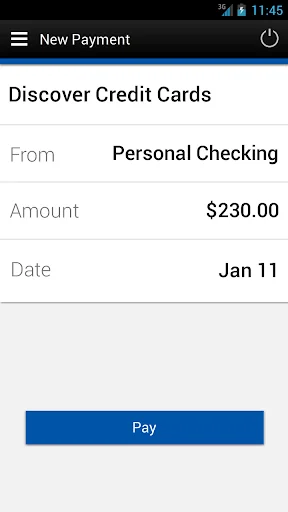
•Make bill payments
•View and activate your cash back offers
•Find EECU locations and CO-OP ATMs.
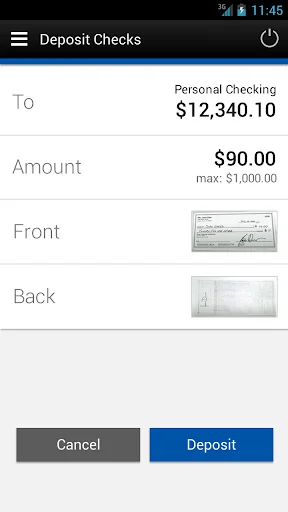
•Make Deposits
Login to this app using your existing Online Access User ID and Password. If you do not …
Educational Employees Credit Union (EECU) – California
The EECU mobile app allows you to access your money – anywhere, anytime. It’s fast, free and secure!
With EECU mobile banking you can:
•Check your balances
•View transaction history
•View check images
•Transfer funds
•Make bill payments
•View and activate your cash back offers
•Find EECU locations and CO-OP ATMs.
•Make Deposits
Login to this app using your existing Online Access User ID and Password. If you do not have EECU Online Access, apply today at myEECU.org.
Also available on Wear OS.
To learn how we protect your privacy, please visit https://www.myeecu.org/privacy
Comparable Android apps
The five apps in Finance with the closest revenue to EECU. Click any to see its detail page.
Each forecast combines App Store rating, ratings count, monetisation model, pricing tier, IAP signals and ad-supported flag.
The base estimate is then multiplied by a per-category scaling factor learned from apps with founder-verified MRR.
Every number on this page comes from public APIs and bumetric's own snapshot history.
Full methodology covers input variables, accuracy bands per category and how we treat apps without comparable anchors.
See also the live data on EECU's tracker page for current rating, reviews and snapshot timeline.
Building something similar? Get a free AI audit with $-revenue forecasts for every recommendation.

 هفتادسی
 Pockit: Bank Card Alternative
 台新銀行 「行動銀行」
 BIP Mobile
 Pluang:Trading Stocks & Crypto