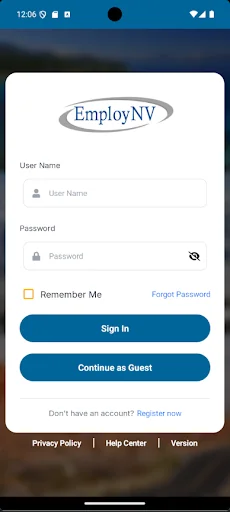
Looking for a great job in Nevada? Find jobs that align with your skillset or training using the EmployNV app. Instantly view any job posted to the web directly on your smart phone or tablet.
Select the latest job openings in your area from nearly 16,000 websites. With the EmployNV mobile app, you can:
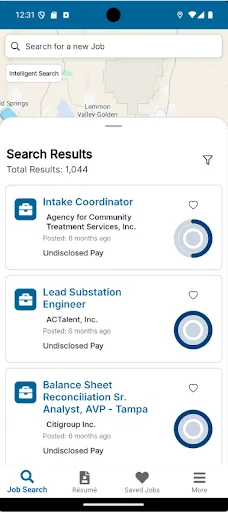
• Search by keyword and location (state/city/zip code). See results in either a list format or as pins on a map.
• Focus on specific industries you’re interested in.
• Save and share your…
Looking for a great job in Nevada? Find jobs that align with your skillset or training using the EmployNV app. Instantly view any job posted to the web directly on your smart phone or tablet.
Select the latest job openings in your area from nearly 16,000 websites. With the EmployNV mobile app, you can:
• Search by keyword and location (state/city/zip code). See results in either a list format or as pins on a map.
• Focus on specific industries you’re interested in.
• Save and share your favorite jobs via email, Facebook or Twitter.
• Map all the latest jobs near your current location using the unique “Jobs Nearby” function.
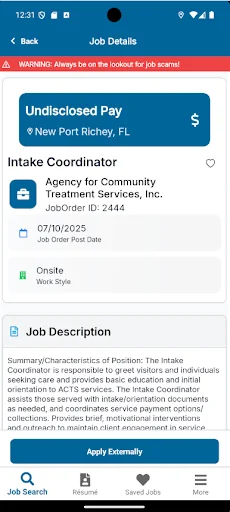
• Tap color-coordinated pins to see more information or to apply for a job.
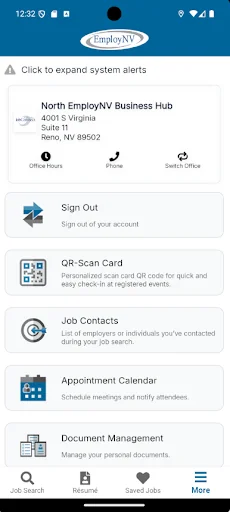
• Instantly return to previous searches, recently viewed jobs and your favorite jobs.
Visit EmployNV at www.EmployNV.gov!
Comparable Android apps
The five apps in Business with the closest revenue to EmployNV. Click any to see its detail page.
Each forecast combines App Store rating, ratings count, monetisation model, pricing tier, IAP signals and ad-supported flag.
The base estimate is then multiplied by a per-category scaling factor learned from apps with founder-verified MRR.
Every number on this page comes from public APIs and bumetric's own snapshot history.
Full methodology covers input variables, accuracy bands per category and how we treat apps without comparable anchors.
See also the live data on EmployNV's tracker page for current rating, reviews and snapshot timeline.
Building something similar? Get a free AI audit with $-revenue forecasts for every recommendation.

 دليل الصفحات الذهبية
 Combo
Combo
 Orbia.ag
 SuperOffice Pocket CRM
 KanTime Mobile