What Endpoint Central actually does (from store listing)
This app will only work in configuration with the Endpoint Central Server available in your business network.
ManageEngine Endpoint Central is a unified endpoint management and security solution designed and developed to safeguard and oversee IT devices running on Windows, Linux, Mac, iPad, iOS, Android, tvOS and Chrome. It offers features such as device monitoring and maintenance, remote troubleshooting, security policy enforcement, software deployment, patch management and OS imaging and d…
This app will only work in configuration with the Endpoint Central Server available in your business network.
ManageEngine Endpoint Central is a unified endpoint management and security solution designed and developed to safeguard and oversee IT devices running on Windows, Linux, Mac, iPad, iOS, Android, tvOS and Chrome. It offers features such as device monitoring and maintenance, remote troubleshooting, security policy enforcement, software deployment, patch management and OS imaging and deployment.
Key features in the mobile app:
Device Onboarding
• Easily add or remove computers that need to be managed
• Keep track of the agent installation progress to check whether your endpoints are connected to the server.
• Manage all the endpoints situated in remote and sub offices.
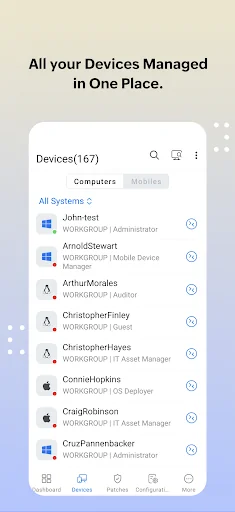
Inventory Management
• View all the managed assets
• Scan hardware and software to get all the details
• Check software compliance and analyse software usage
• Forbid prohibited applications
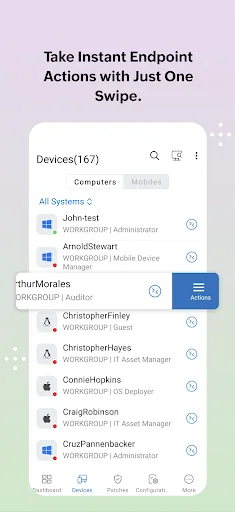
Configurations
• Suspend and resume already deployed configurations
• Save configurations as templates
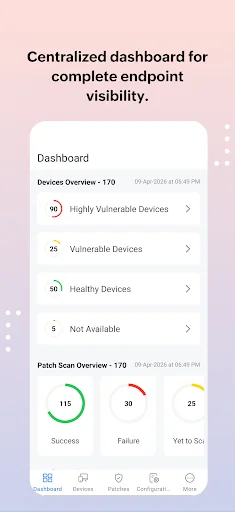
Patch Management
• Scan and identify vulnerable computers
• Detect missing patches for applications (Windows/Mac/Linux/Third-party)
• Approve/Decline patches
• Monitor automated patch deployment tasks
• View system health status
Mobile Device Management
• Scan your mobile devices
• Remotely monitor and lock your managed devices
• Trigger an alarm if your device is stolen.
• Enable corporate wipe to protect sensitive corporate data
• Clear and reset passcode according to your requirements
• Locate and restart your mobile devices
• Enable lost mode to track your devices.
Remote Troubleshooting
• Troubleshoot remote desktops from anywhere
• Ensure users privacy by giving a choice to ask user for permission before connecting
• Automatically detect and display multi-monitors
• Take control of user or computer sessions
Instructions for activation :
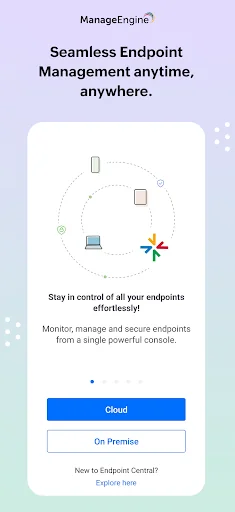
Step 1: Install the Endpoint Central android app on your device
Step 2: Once installed, select Cloud (or) On-premise option
Step 3: For On-premise, give the credentials of server name, port, username and password being used for Endpoint Central Console
Step 4: For Cloud, login using your Zoho account or other IDPs
Awards and Recognitions :
• ManageEngine recognized for the fourth time in the Gartner Magic Quadrant 2022 for Unified Endpoint Management Tools.
• The IDC MarketScape named Zoho (ManageEngine) as a Leader in three 2022 IDC MarketScape vendor assessments for the Unified Endpoint Management (UEM) market
• Endpoint Central bagged CDM Infosec Award 2020 under the 'Next Gen Unified Endpoint Management (UEM) solution' category
• ManageEngine is honored to be recognized in the 2021 Midmarket Context: Magic Quadrant for Unified Endpoint Management (UEM) as a Notable Vendor.
• Approved for use on US Navy networks
Comparable Android apps
The five apps in Business with the closest revenue to Endpoint Central. Click any to see its detail page.
Each forecast combines App Store rating, ratings count, monetisation model, pricing tier, IAP signals and ad-supported flag.
The base estimate is then multiplied by a per-category scaling factor learned from apps with founder-verified MRR.
Every number on this page comes from public APIs and bumetric's own snapshot history.
Full methodology covers input variables, accuracy bands per category and how we treat apps without comparable anchors.
See also the live data on Endpoint Central's tracker page for current rating, reviews and snapshot timeline.
Building something similar? Get a free AI audit with $-revenue forecasts for every recommendation.

 CDL Jobs – Truckers Network
 EmployEase
 دار السبائك
 Saiba Mais VW
 TimeTac Classic