**Please note, to access all the features on the app you will need to allow all the requested permissions. You are more than welcome to deny permissions however please be aware, due to Google's rules, things like attachments won't open if you deny permission to access photo, media and files on your device for example. If you have any queries regarding the permissions we request, please contact support@eschools.co.uk and we'll be happy to answer them.**
If your school uses eSchools, download o…
**Please note, to access all the features on the app you will need to allow all the requested permissions. You are more than welcome to deny permissions however please be aware, due to Google's rules, things like attachments won't open if you deny permission to access photo, media and files on your device for example. If you have any queries regarding the permissions we request, please contact support@eschools.co.uk and we'll be happy to answer them.**
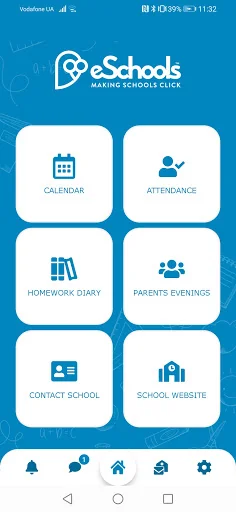
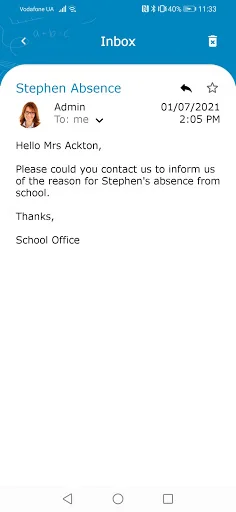
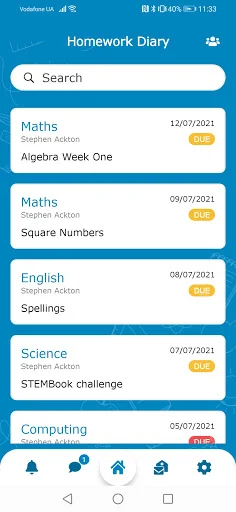
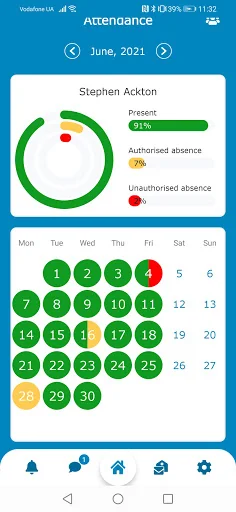
If your school uses eSchools, download our app to gain access to a number of your account features. Communicate with others in your school community through messages, receive text notifications from the school office and view letters that have been sent home. Students and parents can keep on top of deadlines thanks to the new homework diary feature as well as being able to track the attendance records for the current academic year. The contact details of the school are also easily accessible. Please note your school has to be an existing eSchools subscriber to use this App.
Comparable Android apps
The five apps in Education with the closest revenue to eSchools. Click any to see its detail page.
Each forecast combines App Store rating, ratings count, monetisation model, pricing tier, IAP signals and ad-supported flag.
The base estimate is then multiplied by a per-category scaling factor learned from apps with founder-verified MRR.
Every number on this page comes from public APIs and bumetric's own snapshot history.
Full methodology covers input variables, accuracy bands per category and how we treat apps without comparable anchors.
See also the live data on eSchools's tracker page for current rating, reviews and snapshot timeline.
Building something similar? Get a free AI audit with $-revenue forecasts for every recommendation.

 AakarIAS
 Power Plant Engineering
 Economics
 GPA AND CGPA
 Mi UDD