What Eye Charts actually does (from store listing)
Eye Charts is a professionally designed visual acuity testing app that makes it easy to accurately check, record, and track vision over time in children aged 6 and above, whether you are a parent monitoring a child’s eyesight at home or a healthcare professional performing routine screening in practice. Early detection of myopia allows you to take preventive action, seek medical advice promptly, and prevent pseudomyopia from worsening into myopia or stop nearsightedness from deteriorating furthe…
Eye Charts is a professionally designed visual acuity testing app that makes it easy to accurately check, record, and track vision over time in children aged 6 and above, whether you are a parent monitoring a child’s eyesight at home or a healthcare professional performing routine screening in practice. Early detection of myopia allows you to take preventive action, seek medical advice promptly, and prevent pseudomyopia from worsening into myopia or stop nearsightedness from deteriorating further.
DESIGNED TO REDUCE VARIABILITY
Unlike paper charts that fade, warp, or become memorized over time, Eye Charts presents optically accurate optotypes that are randomized for every test. This helps ensure more meaningful results for repeated testing at home, in schools, clinics, or telehealth settings.
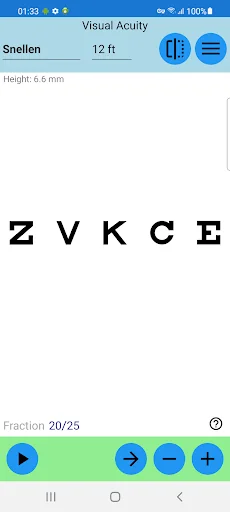
Supported charts include:
* Snellen
* ETDRS
* Landolt C
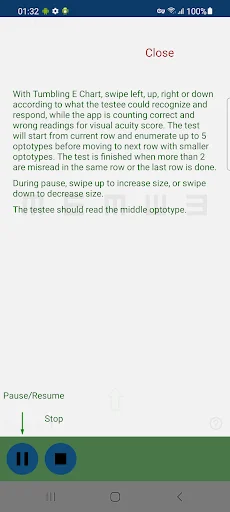
* Tumbling E
* HOTV
* Numbers
* Shapes
The charts use LogMAR scaling of letter size across rows, and support multiple visual acuity notations for scoring, including: Fraction, LogMAR, MAR, Decimal and VAS.
Flexible test distances allow accurate use in small rooms, hallways, or ad‑hoc spaces.
Displayed on iOS and Android devices, Eye Charts is self‑illuminated, so the chart’s visibility does not depend on room lighting or weather. Screen brightness is adjustable and can be set appropriately for longer testing distances such as 6 meters.
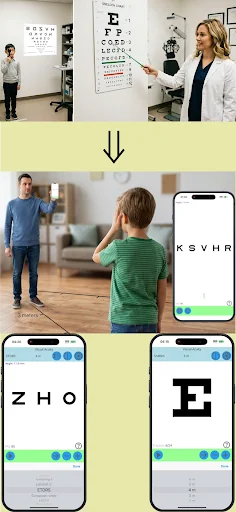
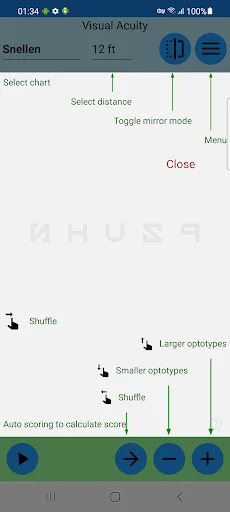
Scenarios:
1. Doctor and Patient.
2. Self-diagnosis using a mirror – Stand in front of a mirror with the app in mirror mode, wearing an eye patch over one eye. The effective test distance is twice the distance between you and the mirror.
3. Self-diagnosis using a Bluetooth keyboard – Place the device a few meters away on a table, and use the keyboard arrow keys to indicate what you can read.
SEE TRENDS, NOT JUST SNAPSHOTS
Test results can be recorded for individual subjects and visualized over time using simple line graphs, making it easier to identify:
* Gradual changes in vision
* Stability after intervention
This longitudinal view is valuable for parents monitoring children’s eyesight and for clinicians tracking changes across visits.
INDEPENDENTLY EVALUATED ACCURACY
Eye Charts was previously published as Visual Acuity Charts. Under that name, it was independently evaluated in a peer‑reviewed academic study published in JAMA Ophthalmology and available via PubMed Central on https://www.ncbi.nlm.nih.gov/pmc/articles/PMC7809609/. In that study, researchers objectively compared multiple iPhone‑based visual acuity apps by physically measuring optotype accuracy across devices. Visual Acuity Charts demonstrated the lowest measurement error among the apps evaluated, making it the most accurate app tested in that comparison.
Myopia detection involves several steps, with distance visual acuity testing often being the first. A decline in visual acuity may indicate the onset of myopia, enabling early intervention.
DISCLAIMER:
While this app may replace printed eye charts, it CANNOT replace doctors or optometrists who perform comprehensive eye exams essential for maintaining eye health. The app does not test for strabismus, esotropia, exotropia, hyperopia, or astigmatism—common early vision conditions. Please consult an optometrist regularly and seek professional medical advice at the first signs of visual acuity issues.
Comparable Android apps
The five apps in Medical with the closest revenue to Eye Charts. Click any to see its detail page.
Each forecast combines App Store rating, ratings count, monetisation model, pricing tier, IAP signals and ad-supported flag.
The base estimate is then multiplied by a per-category scaling factor learned from apps with founder-verified MRR.
Every number on this page comes from public APIs and bumetric's own snapshot history.
Full methodology covers input variables, accuracy bands per category and how we treat apps without comparable anchors.
See also the live data on Eye Charts's tracker page for current rating, reviews and snapshot timeline.
Building something similar? Get a free AI audit with $-revenue forecasts for every recommendation.
 ICF Codes
 Hapvida NotreDame
 TousAntiCovid
 BioRabbits
 Meu SUS Digital