1.2M Assets Tracked Updated 5 min ago Revenue Forecasts
Create Account Sign In
Home
Eye Test Charts icon

How much does Eye Test Charts earn?

Android app from App Park · Health & Fitness

ML forecast ★ 2.9 · 517 Free

~348/mo

ML revenue forecast. Calibrated against 31551 apps in this category.

Confidence band
±15%
High — many comparable apps with verified data

At a glance

What the app looks like

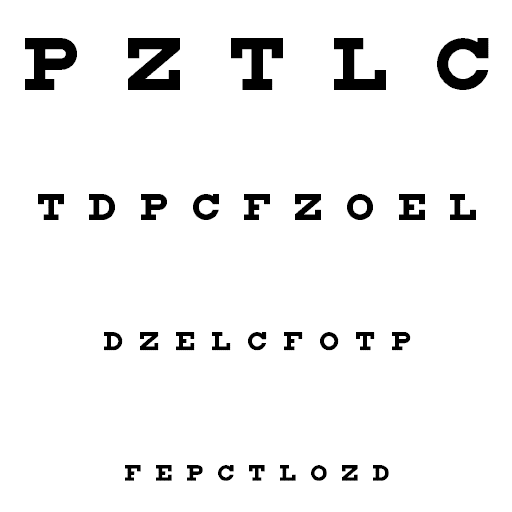
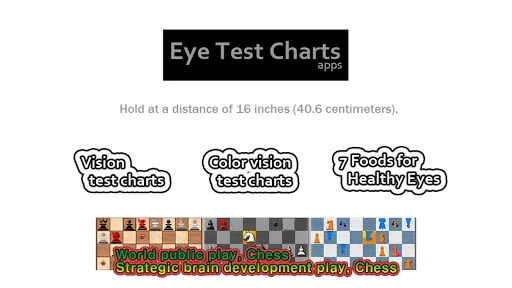
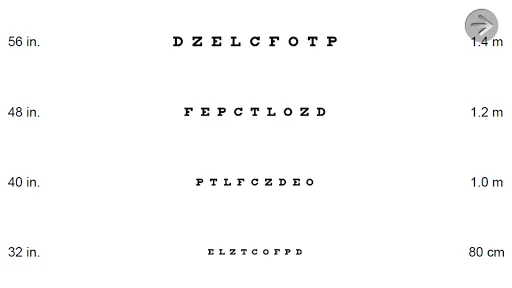
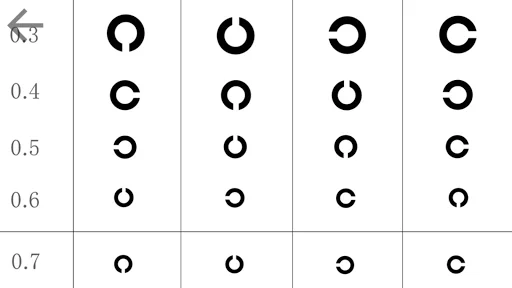
Live screenshots from the Play Store, captured by our snapshot worker. Tap any image to enlarge.

Eye Test Charts screenshot 1 Eye Test Charts screenshot 2 Eye Test Charts screenshot 3 Eye Test Charts screenshot 4

Eye Test Charts's revenue trajectory

Forecast revenue from snapshot history. Last 1 months.

Where Eye Test Charts sits in Health & Fitness

Revenue distribution of 31551 comparable apps. Eye Test Charts highlighted.

Eye Test Charts vs comparable apps

Revenue trajectory side-by-side. Bold = Eye Test Charts, ghosted = peers.

App spec

Version
Varies with device
Launched
Feb 03, 2015
Price
Free
Monetization
Free

What Eye Test Charts actually does (from store listing)

This eye test allows you to check your visual acuity. The App is FREE. - Vision Test charts - Color vision Test charts. - 7 Foods for Healthy Eyes. This application is not intended to replace optician's regular full examination. We recommend you get a full eye test after using it.

Comparable Android apps

The five apps in Health & Fitness with the closest revenue to Eye Test Charts. Click any to see its detail page.

AppRevenueRatingRatings
Vibration App: Vibrator Strong icon Vibration App: Vibrator Strong 348 ★ 3.6 26K
Eight Sleep icon Eight Sleep 348 ★ 4.1 3K
Exercise Calorie Calculator icon Exercise Calorie Calculator 348 ★ 4.3 732
Places Tracker icon Places Tracker 348 0
習慣化・自己管理アプリ – 禁欲カウンターで自信と集中力UP icon 習慣化・自己管理アプリ – 禁欲カウンターで自信と集中力UP 348 0
Own Eye Test Charts? Replace our estimate with your real revenue via Stripe Connect or ASC. Get a public Verified badge.
Claim & verify →

How we calculated this

Each forecast combines App Store rating, ratings count, monetisation model, pricing tier, IAP signals and ad-supported flag. The base estimate is then multiplied by a per-category scaling factor learned from apps with founder-verified MRR. Every number on this page comes from public APIs and bumetric's own snapshot history.

Full methodology covers input variables, accuracy bands per category and how we treat apps without comparable anchors. See also the live data on Eye Test Charts's tracker page for current rating, reviews and snapshot timeline.

Building something similar? Get a free AI audit with $-revenue forecasts for every recommendation.
Audit my app →