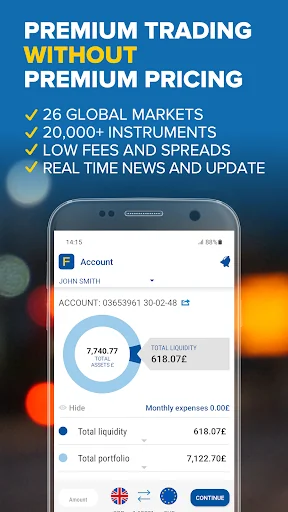
Introducing Fineco: the premium trading platform without premium prices.
Zero commission and no added spreads on Share CFDs.
TAKE YOUR TRADING TO THE NEXT LEVEL
• £0 commission and 0 markup on Share CFDs, only market spread.
• Access 26 global markets and trade 20,000+ financial instruments worldwide
• 3 platforms with powerful trading tools and a wide range of news and analysis
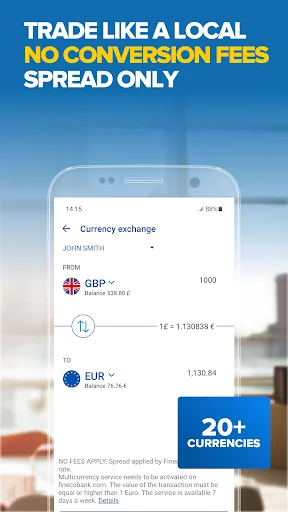
• Global multicurrency account, no conversion fees, spread only
All our platforms are designed and built …
Introducing Fineco: the premium trading platform without premium prices.
Zero commission and no added spreads on Share CFDs.
TAKE YOUR TRADING TO THE NEXT LEVEL
• £0 commission and 0 markup on Share CFDs, only market spread.
• Access 26 global markets and trade 20,000+ financial instruments worldwide
• 3 platforms with powerful trading tools and a wide range of news and analysis
• Global multicurrency account, no conversion fees, spread only
All our platforms are designed and built in-house and are currently handling 75,000 executed orders on a daily basis.
GLOBAL MARKET TRADING
• SHARE CFDs: ZERO COMMISSION AND NO ADDED SPREADS
• Shares and ETFs on LSE, US and EU markets at a low fixed fee per order
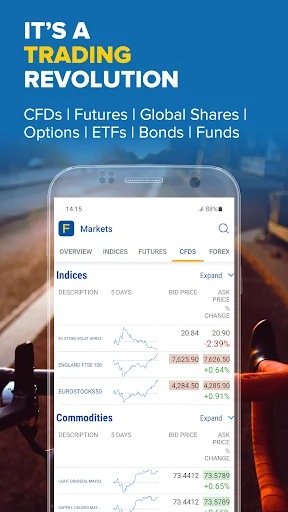
• Global CFDs including Stocks, Forex, Indices, Commodities and Bonds
• Forex – 50+ pairs and 24/7 trading
• Options on S&P, Nasdaq, DJ, Russell and VIX Indices
• Commodities – trade oil, metals, energies and more
• Futures – low commissions on CME, EUREX & IDEM including mini and micro futures
• Bonds – fixed commission on 5,700+ government and corporate bonds
• Trade directly in GBP, EUR, USD, CHF and more currencies
PROFESSIONAL TRADING DATA AND TOOLS
• Free real-time quotes for UK, EU and US Markets
• Professional interactive charting system featuring customisable timeframes and technical indicators
• Stock order books on 5 levels
• Real-time news and from Reuters, MF-DJ and more
• Keep track of your positions and manage your risk with stops and limits
• Economic calendar and upcoming events to plan your daily strategy
THE PLACE TO INVEST
• Global multi-brand funds at 0.25% max. annual platform fee.
• Stocks and ETFs at a flat fee per order: £2.95 on UK, €/$ 3.95 on EU and US shares
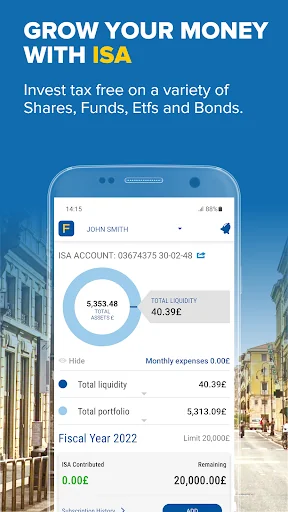
• Save money - tax-free - with our Stocks and Shares ISA
• Invest globally in the local currency, saving currency conversion fees
• Over 6,000 Bonds, including Gilts, worldwide
ONE ACCOUNT. 20+ CURRENCIES. NO MONTHLY FEE
• Trading, investment and banking services in one account
• GBP, EUR, CHF, USD, more than 20 currencies
• Real-time currency conversion
• No custody or administration fees
• No minimum deposit required
• One password. One PIN. All from one smart account with fingerprint
Do you want more? Here we are
TRAVEL WITH NO BOUNDARIES
• Free VISA Debit card in EUR or GBP
• Free withdrawals anywhere in Europe with the EUR card.
• In-app features for full control: geo-blocking and card limits tools
• Withdraw up to £5,000 at a time
• Instant transfers and bills payments in EUR
• MoneyMap: the smart budget tracker automatically groups your income and spending in fixed or personalised categories. It is included in your account and App
A STELLAR MOBILE EXPERIENCE
Bring your mobile trading to the next level with Fineco’s app. Advanced tools, live feed and dynamic charts always in your pocket.
ABOUT FINECO
Over 20 years of experience in brokerage, investments, banking, and financial services. One of the most robust banks you’ve ever known.
• +1.3 million clients in Italy and €70 billion in total financial assets.
• More than 30 million orders processed every year by Fineco
• Listed on the Italian Stock Exchange and part of the Euro Stoxx 600 Index.
Advertising message. All trading involves risks, losses can exceed deposits
69.17% of retail investor accounts lose money due to CFD trading with Fineco.
To view all the terms and conditions for the advertised services, please refer to the fact sheets and documentation required under current regulations. All services require the client to open a Fineco current account.
Each forecast combines App Store rating, ratings count, monetisation model, pricing tier, IAP signals and ad-supported flag.
The base estimate is then multiplied by a per-category scaling factor learned from apps with founder-verified MRR.
Every number on this page comes from public APIs and bumetric's own snapshot history.
Full methodology covers input variables, accuracy bands per category and how we treat apps without comparable anchors.
See also the live data on Fineco's tracker page for current rating, reviews and snapshot timeline.
Building something similar? Get a free AI audit with $-revenue forecasts for every recommendation.


 SC Mobile India
 Mirae Asset Sharekhan: Invest
 Sofisa Direto: Conta e Cartão
 Cent Mobile
 Royal Bank of Scotland