ML revenue forecast.
Calibrated against 16749 apps in this category.
Confidence band
±15%
High — many comparable apps with verified data
At a glance
Earns 6.15× more than the category median (277/mo).
Ranks #1,162 of 16,749 in Simulation (top 6.9% by revenue).
Launched May 30, 2012 · last updated Mar 11, 2020.
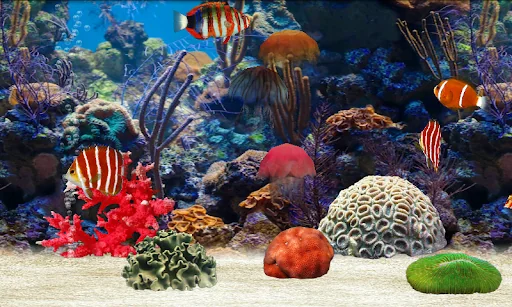
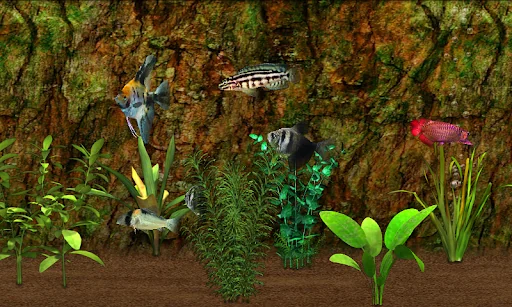
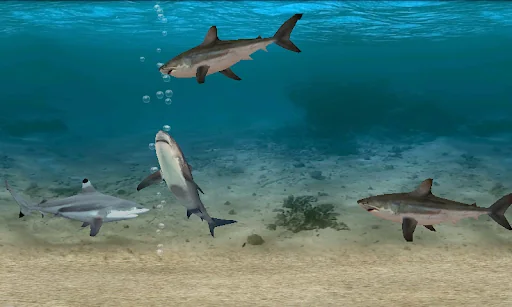
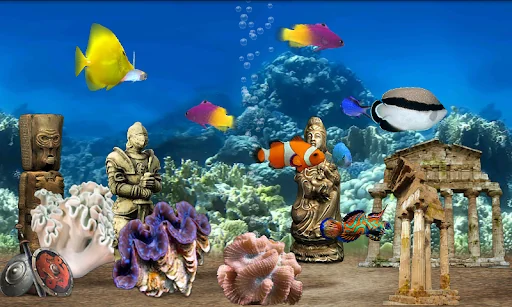
What the app looks like
Live screenshots from the Play Store, captured by our snapshot worker. Tap any image to enlarge.
Fish Farm's revenue trajectory
Forecast revenue from snapshot history. Last 3 months.
Where Fish Farm sits in Simulation
Revenue distribution of 16749 comparable apps. Fish Farm highlighted.
Fish Farm vs comparable apps
Revenue trajectory side-by-side. Bold = Fish Farm, ghosted = peers.
App spec
Version
1.5.1
Last update
Mar 11, 2020
Launched
May 30, 2012
Price
Free
Monetization
Free
What Fish Farm actually does (from store listing)
Fish Farm 2 is out now. Try it out as well!
Fish Farm is an exciting 3D aquarium experience that gives you creative control - customize beautiful marine environments for saltwater or freshwater fish.
With 205 exotic 3D fish and sharks along with 90+ decorations at your fingertips, the possibilities are limitless. Buy, breed, and sell exotic freshwater or saltwater fish. Reaching higher levels in the app earns coins and access to more fish, backgrounds, and aquarium decorations.
Feed you…
Fish Farm is an exciting 3D aquarium experience that gives you creative control - customize beautiful marine environments for saltwater or freshwater fish.
With 205 exotic 3D fish and sharks along with 90+ decorations at your fingertips, the possibilities are limitless. Buy, breed, and sell exotic freshwater or saltwater fish. Reaching higher levels in the app earns coins and access to more fish, backgrounds, and aquarium decorations.
Feed your vibrantly colored fish, observe them as they play - even annoy them by tapping the glass!
With Fish Farm, everything from the species of fish to the undersea home is yours to create!
Features:
* 205 brilliantly colored, realistic 3D fish and sharks to choose from
* Customize your aquariums with 90+ different decorative items
* Feed your fish, watch them play, and tap the glass to annoy them
* Buy, raise, breed, and sell fish to earn coins and gain experience
* Use Fish Farm as Live Wallpaper, so you can enjoy your aquariums all the time
* Care for up to 20 saltwater or freshwater aquariums
* Enjoy offline play capability
* Pay once, get the Exchange, and access all game features easily
Fish Farm has gained huge popularity in the iOS App Store; it is now available for Android.
In case of problems or questions: android@bitbros-games.com
AppEggs.com (http://appeggs.com/): Build Your Own Realistic 3D Aquarium on Your Android Device!
Please note that Fish Farm 3 is free to play and thus ad-financed.
Comparable Android apps
The five apps in Simulation with the closest revenue to Fish Farm. Click any to see its detail page.
Each forecast combines App Store rating, ratings count, monetisation model, pricing tier, IAP signals and ad-supported flag.
The base estimate is then multiplied by a per-category scaling factor learned from apps with founder-verified MRR.
Every number on this page comes from public APIs and bumetric's own snapshot history.
Full methodology covers input variables, accuracy bands per category and how we treat apps without comparable anchors.
See also the live data on Fish Farm's tracker page for current rating, reviews and snapshot timeline.
Building something similar? Get a free AI audit with $-revenue forecasts for every recommendation.

 Hamster Village
 Dream Girlfriend
 Driver Simulator Life
 Robot Shark
 4x4 Offroad Racing