ML revenue forecast.
Calibrated against 6486 apps in this category.
Confidence band
±15%
High — many comparable apps with verified data
At a glance
Earns 1.69× more than the category median (224/mo).
Ranks #2,056 of 6,486 in Racing (top 31.7% by revenue).
Launched Dec 10, 2015 · last updated Feb 09, 2026.
What the app looks like
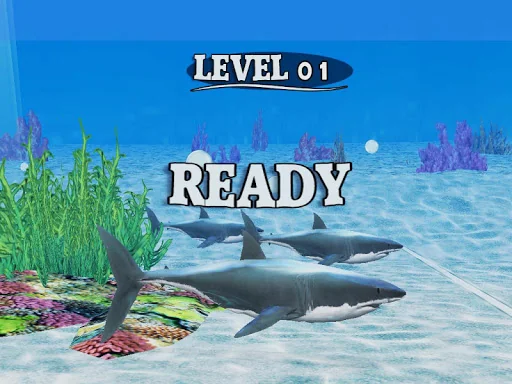
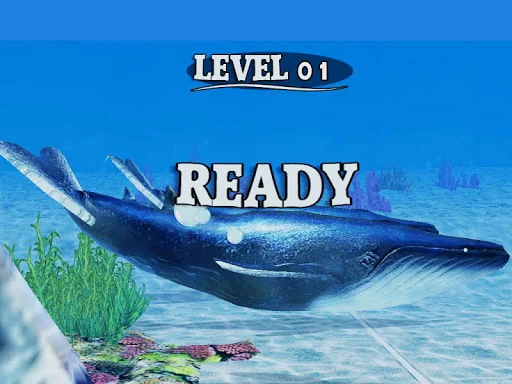
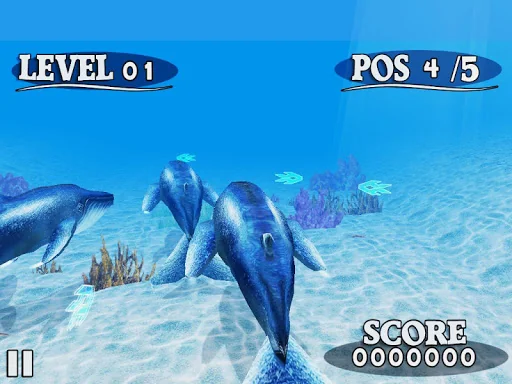
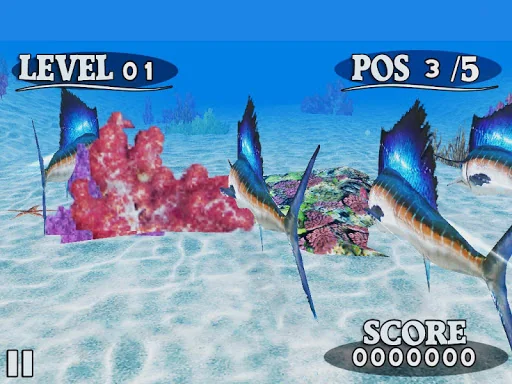
Live screenshots from the Play Store, captured by our snapshot worker. Tap any image to enlarge.
Fish Race's revenue trajectory
Forecast revenue from snapshot history. Last 1 months.
Where Fish Race sits in Racing
Revenue distribution of 6486 comparable apps. Fish Race highlighted.
Fish Race vs comparable apps
Revenue trajectory side-by-side. Bold = Fish Race, ghosted = peers.
App spec
Version
22.000
Last update
Feb 09, 2026
Launched
Dec 10, 2015
Price
Free
Monetization
Free
What Fish Race actually does (from store listing)
Dive into the ocean and join hilarious underwater races with Fish Race!
Choose your champion among clownfish, shark, seahorse, manta ray, eel, swordfish, whale… and soon exclusive new fishes 🐡⚡
Avoid obstacles, collect boosts, and outrun your rivals to become the fastest fish in the world.
Compete against players from all over the globe thanks to the international leaderboard 🌍🏆 (your country’s flag is displayed automatically).
✨ Game Features:
🚀 Adrenaline-packed races
🐳 7 unique play…
Dive into the ocean and join hilarious underwater races with Fish Race!
Choose your champion among clownfish, shark, seahorse, manta ray, eel, swordfish, whale… and soon exclusive new fishes 🐡⚡
Avoid obstacles, collect boosts, and outrun your rivals to become the fastest fish in the world.
Compete against players from all over the globe thanks to the international leaderboard 🌍🏆 (your country’s flag is displayed automatically).
Each forecast combines App Store rating, ratings count, monetisation model, pricing tier, IAP signals and ad-supported flag.
The base estimate is then multiplied by a per-category scaling factor learned from apps with founder-verified MRR.
Every number on this page comes from public APIs and Bumetric's own snapshot history.
Full methodology covers input variables, accuracy bands per category and how we treat apps without comparable anchors.
See also the live data on Fish Race's tracker page for current rating, reviews and snapshot timeline.
Building something similar? Get a free AI audit with $-revenue forecasts for every recommendation.


 Toon Chase - Run away
 Offroad Jeep Racing Extreme
 Hyper Drift!
 ZeptoRacer 3D
 Sky Roads 3D - Galaxy Racing