What FishDonkey actually does (from store listing)
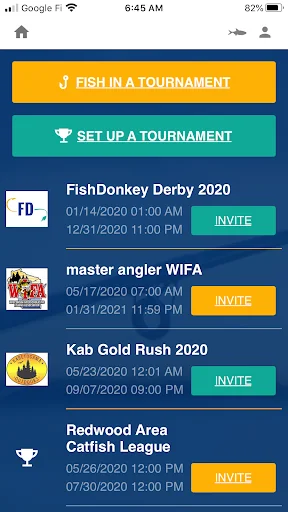
Create and run fishing tournaments on a mobile phone: Catch and release,traditional tournaments by weight or length, bracket (playoff style) head to head tournaments, multi day (Day 1 + Day 2 + Day 3), points based tournaments, photo or video. This is the best and easiest platform with the most options for running your event. FishDonkey is the Future of Tournament Fishing®.
Conservation is an important aspect of tournament fishing. Not only do we enable our users to run fun and exciting …
Create and run fishing tournaments on a mobile phone: Catch and release,traditional tournaments by weight or length, bracket (playoff style) head to head tournaments, multi day (Day 1 + Day 2 + Day 3), points based tournaments, photo or video. This is the best and easiest platform with the most options for running your event. FishDonkey is the Future of Tournament Fishing®.
Conservation is an important aspect of tournament fishing. Not only do we enable our users to run fun and exciting fishing tournaments, but we also help conserve the fishery on your local lake.
This app also enables you to maintain social distancing while running a tournament!
The app includes:
- Online payment, online registration.
- Live leaderboards with exciting updates all day long.
- Anti-cheating technologyTM.
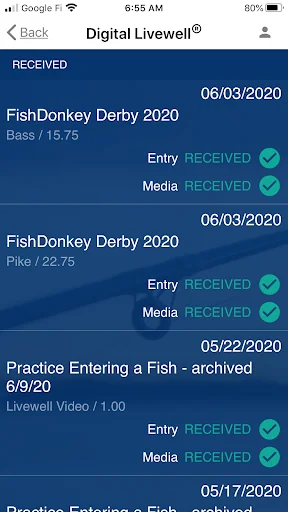
- Digital Livewell®.
- Boat Check-ins and Livewell Checks.
- Cheating/fraud prevention tools.
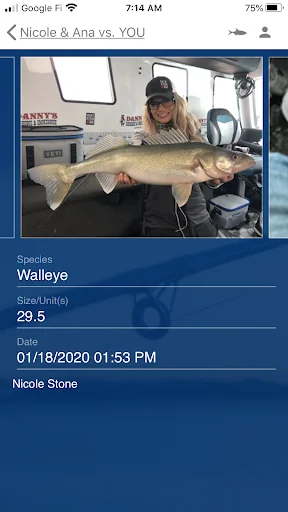
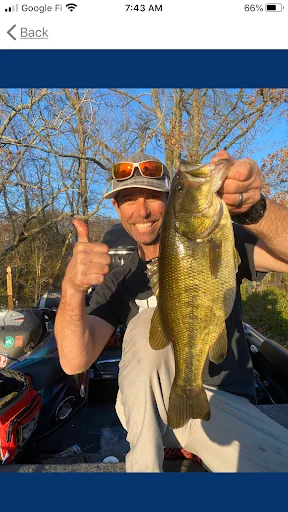
- Date and time stamped photos and videos.
- Flexible tournament creation allows you to customize your tournament.
Best at Tournament Creation
The FishDonkey app has built in options to help you create and run an automated tournament just the way you want. Create a variety of tournament options such as biggest fish, largest stringer of fish, grand slam, multispecies tournaments, wildcard, or custom names. You can run a tournament anywhere. Specify any length of time, an hour, a month… easily define and manage the start and end dates. Track daily or weekly winners.
Highlighted Features
Works without an internet connection.
Prevents cheating in catch and release tournaments.
Send any participant (or all) messages by email, text, or phone call from the app.
Enter your sponsors, prizes, rules, logos and welcome message.
Define multiple divisions for children, kayak, boat fishing, angler, co-angler, etc.
Potential uses
Local fishing leagues
World-wide tournaments
High School Tournament Trail
Team practice sessions
Ice fishing tournaments, boat tournaments, shore tournaments, team tournaments Multi-species tournaments
Tournaments with divisions (veterans, children, etc.)
Cost
It is free to create a tournament. Anglers pay a small fee when they join. (All pricing policies are subject to change.)
Comparable Android apps
The five apps in Sports with the closest revenue to FishDonkey. Click any to see its detail page.
Each forecast combines App Store rating, ratings count, monetisation model, pricing tier, IAP signals and ad-supported flag.
The base estimate is then multiplied by a per-category scaling factor learned from apps with founder-verified MRR.
Every number on this page comes from public APIs and bumetric's own snapshot history.
Full methodology covers input variables, accuracy bands per category and how we treat apps without comparable anchors.
See also the live data on FishDonkey's tracker page for current rating, reviews and snapshot timeline.
Building something similar? Get a free AI audit with $-revenue forecasts for every recommendation.


 Tahuichi
 Heracles Almelo
 Aussois
 25/26 NHL Schedule & Reminder
 MyKBO Live