What Flick Erasers actually does (from store listing)
◇◆◇ Thanks to all of you, we have reached 10,000,000 downloads, thank you very much! ◇◆◇
We have received a great response, especially from schools and workplaces!
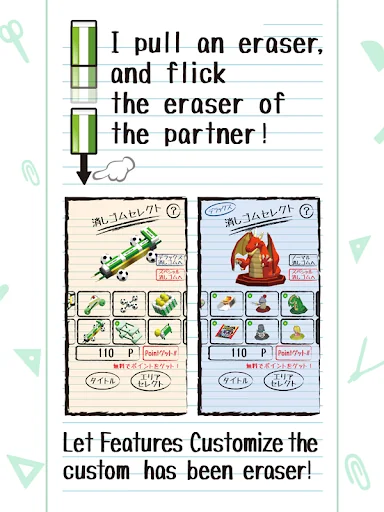
Flick! Hit! Push!
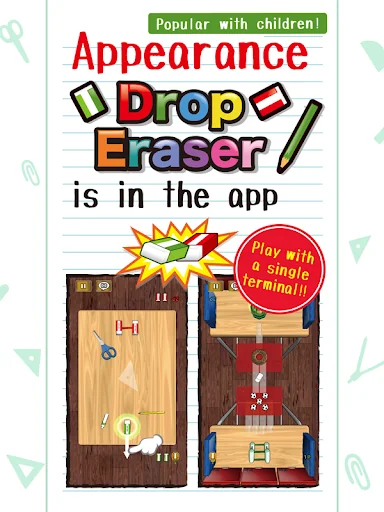
Good old DropEraser comes up by application!
Flick the eraser of the enemy to the outside of the desk!
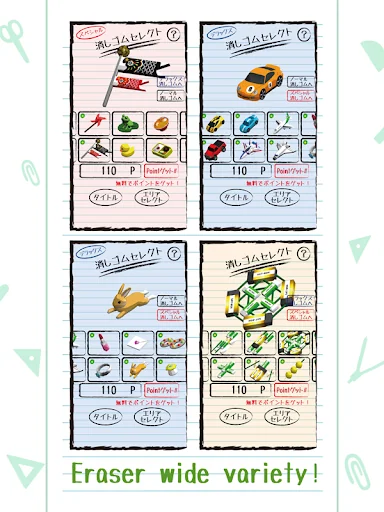
The usable eraser more than 200 kinds!
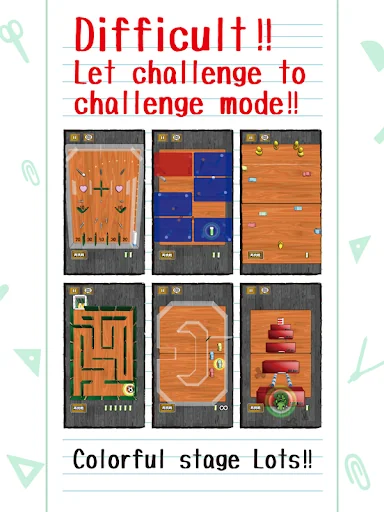
I defeat an enemy, and let's leave all erasers open!
A play is possible to up to four people with the Multi-play mode!
It is certain that I liven up with a friend…
◇◆◇ Thanks to all of you, we have reached 10,000,000 downloads, thank you very much! ◇◆◇
We have received a great response, especially from schools and workplaces!
Flick! Hit! Push!
Good old DropEraser comes up by application!
Flick the eraser of the enemy to the outside of the desk!
The usable eraser more than 200 kinds!
I defeat an enemy, and let's leave all erasers open!
A play is possible to up to four people with the Multi-play mode!
It is certain that I liven up with a friend and a family!
Send by mail the following inquiries about this application
satboxuserhelp@gmail.com
Comparable Android apps
The five apps in Action with the closest revenue to Flick Erasers. Click any to see its detail page.
Each forecast combines App Store rating, ratings count, monetisation model, pricing tier, IAP signals and ad-supported flag.
The base estimate is then multiplied by a per-category scaling factor learned from apps with founder-verified MRR.
Every number on this page comes from public APIs and bumetric's own snapshot history.
Full methodology covers input variables, accuracy bands per category and how we treat apps without comparable anchors.
See also the live data on Flick Erasers's tracker page for current rating, reviews and snapshot timeline.
Building something similar? Get a free AI audit with $-revenue forecasts for every recommendation.

 Flourishing Empires
 Subdivision Infinity
 High School Gang
 Armored Squad: Mechs vs Robots
 Brutal.io