What Food additives actually does (from store listing)
Food Additives is a free, ad-free application, which helps you identify more than 650 additives (E numbers) that are present in many everyday food products.
Features:
For each additive:
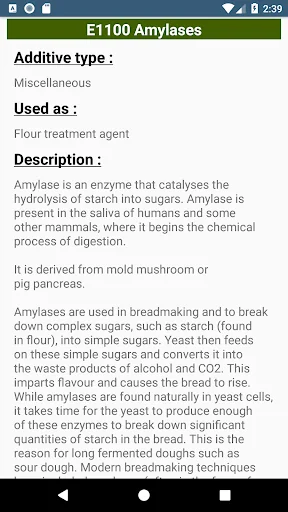
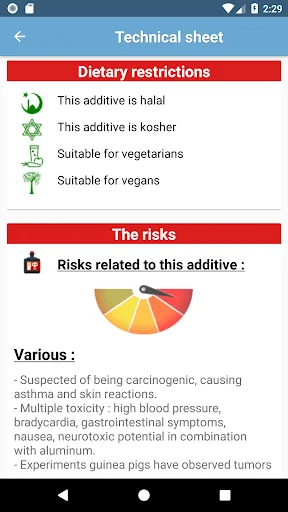
✦ The level of danger
✦ The origin (animal, vegetable, chemical ...)
✦ the type (Food coloring, emulsifier, preservative ...)
✦ The name and all the possible names
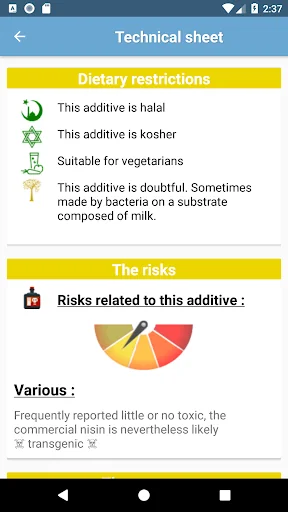
✦ the status that lets you know if the additive is halal / kosher / vegetarian or vegan.
✦ A highly optimized search mode (by number, eg 1…
Food Additives is a free, ad-free application, which helps you identify more than 650 additives (E numbers) that are present in many everyday food products.
Features:
For each additive:
✦ The level of danger
✦ The origin (animal, vegetable, chemical ...)
✦ the type (Food coloring, emulsifier, preservative ...)
✦ The name and all the possible names
✦ the status that lets you know if the additive is halal / kosher / vegetarian or vegan.
✦ A highly optimized search mode (by number, eg 124 or by name, eg: Cochineal Red)
✦ Integrated sorting mode to simplify navigation through our database
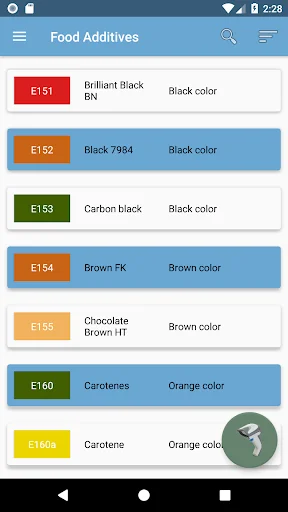
✦ A complete and up-to-date database (more than 650 food additives)
✦ A dictionary of the most used words in the world of additives
✦ Information on nanoparticles and ultra-processed foods
✦ Sources for more details (using internet)
A product scan option :
Since version 2.0 the application offers a paid scan service.
More than 500,000 international products available via the Open Food Facts database, hence the following new permissions requests :
- Permission to use the camera: to be able to scan a product the application uses the camera.
Note: It is not possible to take pictures or record videos via the app.
- Permission to use the internet: as you can imagine, a database of more than 500 000 products can not be downloaded to the device, therefore the application accesses the internet to collect the data of each scanned product.
What does the scan option offer?
For each scanned product:
✦ List of food additives where each additive is clickable to display details
✦ List of ingredients with allergens in bold
✦ Possible traces of gluten, nuts, milk ... etc.
✦ The origin of the ingredients
We are reachable by e-mail for any questions or suggestions for the improvement of the application.
Comparable Android apps
The five apps in Health & Fitness with the closest revenue to Food additives. Click any to see its detail page.
Each forecast combines App Store rating, ratings count, monetisation model, pricing tier, IAP signals and ad-supported flag.
The base estimate is then multiplied by a per-category scaling factor learned from apps with founder-verified MRR.
Every number on this page comes from public APIs and bumetric's own snapshot history.
Full methodology covers input variables, accuracy bands per category and how we treat apps without comparable anchors.
See also the live data on Food additives's tracker page for current rating, reviews and snapshot timeline.
Building something similar? Get a free AI audit with $-revenue forecasts for every recommendation.
 Gettoworkout Fitness App
 Zorgzaam
 Bench press +50lbs
 Zone Diet Free
 GlobeMed Fit