The only technology that makes data accessible to all football players.
Get your statistics after each football session, compare yourself to professional players and your teammates.
Play. Measure. Progress with the Footbar sensor!
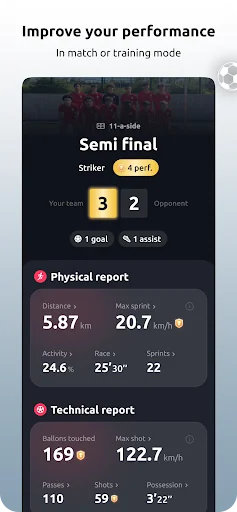
With Footbar, get your physical stats: km covered, average speed, max sprint, etc., AND the technical stats of your activity on the field: number of passes, shots, shot power, ball touches, etc.
TRACK YOUR PERFORMANCE
Train and track your progress througho…
The only technology that makes data accessible to all football players.
Get your statistics after each football session, compare yourself to professional players and your teammates.
Play. Measure. Progress with the Footbar sensor!
With Footbar, get your physical stats: km covered, average speed, max sprint, etc., AND the technical stats of your activity on the field: number of passes, shots, shot power, ball touches, etc.
TRACK YOUR PERFORMANCE
Train and track your progress throughout the season
Record your 5-a-side, 7-a-side, 8-a-side, 11-a-side football sessions, trainings, and runs!
Get a history of all your sessions
Rely on the coach's analysis with your strengths and areas for improvement
EASY TO USE
Using the Footbar sensor is super simple
Turn on your sensor using the Footbar app before your session
Leave your phone in the locker room and join your teammates on the field
At the end of the session, turn off your sensor and download your stats
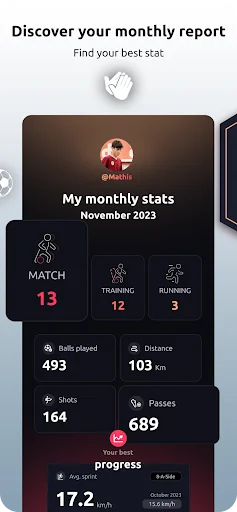
CREATE YOUR FOOTBAR PLAYER CARD
Each season, you can track the evolution of your own Footbar player card
DRI, time spent with the ball (in seconds)
PHY, distance covered (in kilometers)
VIT, time spent above 20km/h
TIR, number of shots
PAS, number of passes
DEF, number of interception attempts
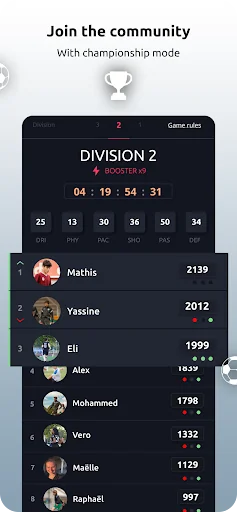
CHALLENGE THE COMMUNITY IN THE CHAMPIONSHIP
Show all the other players that you are the greatest crack
Dominate the championship and climb the divisions
Challenge the best Footbar players
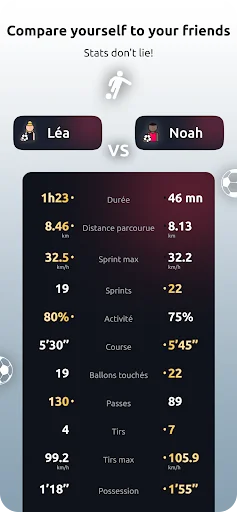
MEN LIE, BUT STATS DON'T
Have you always dreamed of knowing if you are better than your teammates? We have the solution for you.
And if you think your friends are no good anyway, you can also compare yourself with professional players...
Support:
Our FAQ: https://footbar.com/pages/faq
Our user guide: https://footbar.com/pages/start
Our privacy policy: https://footbar.com/policies/privacy-policy
Our terms and conditions: https://footbar.com/pages/termes-et-conditions
Problem? Contact support at: help@footbar.com
Comparable Android apps
The five apps in Sports with the closest revenue to Footbar. Click any to see its detail page.
Each forecast combines App Store rating, ratings count, monetisation model, pricing tier, IAP signals and ad-supported flag.
The base estimate is then multiplied by a per-category scaling factor learned from apps with founder-verified MRR.
Every number on this page comes from public APIs and bumetric's own snapshot history.
Full methodology covers input variables, accuracy bands per category and how we treat apps without comparable anchors.
See also the live data on Footbar's tracker page for current rating, reviews and snapshot timeline.
Building something similar? Get a free AI audit with $-revenue forecasts for every recommendation.

 DJK Winfried Huttrop Handball
 TV Ennigerloh Handball
 HSG Rhein-Nahe Bingen
 Pelicans
 Deventer hockey