Android app
from Fort Osage R1 School District
· Education
ML forecast★ 3.3 · 147Free
~252/mo
ML revenue forecast.
Calibrated against 120891 apps in this category.
Confidence band
±15%
High — many comparable apps with verified data
At a glance
Earns 1.58× more than the category median (159/mo).
Ranks #28,541 of 120,891 in Education (top 23.6% by revenue).
Launched Jul 30, 2013.
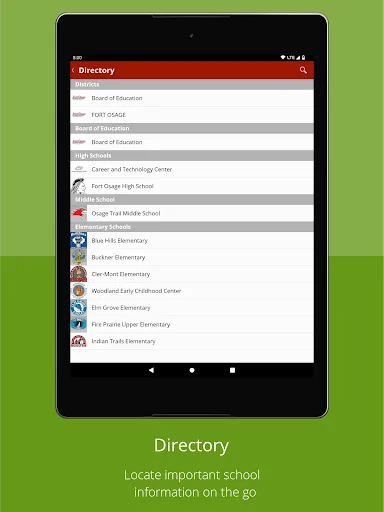
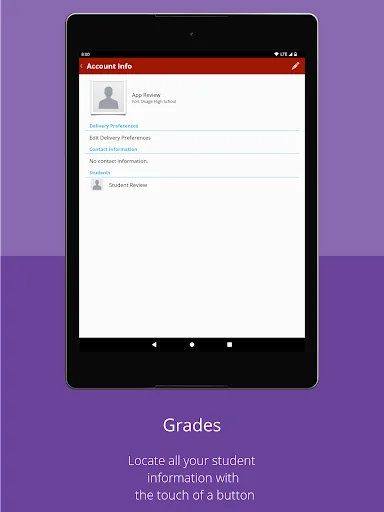
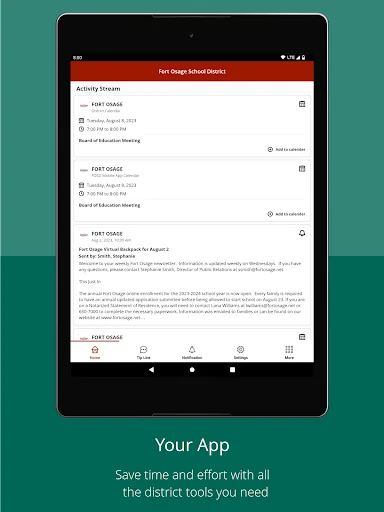
What the app looks like
Live screenshots from the Play Store, captured by our snapshot worker. Tap any image to enlarge.
Fort Osage School District's revenue trajectory
Forecast revenue from snapshot history. Last 1 months.
Where Fort Osage School District sits in Education
Revenue distribution of 120891 comparable apps. Fort Osage School District highlighted.
Fort Osage School District vs comparable apps
Revenue trajectory side-by-side. Bold = Fort Osage School District, ghosted = peers.
App spec
Version
Varies with device
Launched
Jul 30, 2013
Price
Free
Monetization
Free
What Fort Osage School District actually does (from store listing)
The official Fort Osage School District app gives you a personalized window into what is happening at the district and schools. Get the news and information that you care about and get involved.
Anyone Can:
-View District and school news
-Use the district tip line
-Receive notifications from the district and schools
-Access the district directory
-Display information personalized to your interests
Parents and students can:
-View and add contact informati…
The official Fort Osage School District app gives you a personalized window into what is happening at the district and schools. Get the news and information that you care about and get involved.
Anyone Can:
-View District and school news
-Use the district tip line
-Receive notifications from the district and schools
-Access the district directory
-Display information personalized to your interests
Parents and students can:
-View and add contact information
Comparable Android apps
The five apps in Education with the closest revenue to Fort Osage School District. Click any to see its detail page.
Each forecast combines App Store rating, ratings count, monetisation model, pricing tier, IAP signals and ad-supported flag.
The base estimate is then multiplied by a per-category scaling factor learned from apps with founder-verified MRR.
Every number on this page comes from public APIs and bumetric's own snapshot history.
Full methodology covers input variables, accuracy bands per category and how we treat apps without comparable anchors.
See also the live data on Fort Osage School District's tracker page for current rating, reviews and snapshot timeline.
Building something similar? Get a free AI audit with $-revenue forecasts for every recommendation.


 Soy Autónoma
 Easy Class
 Masters In Ethical Hacking
 My Wow! Videos
 Abhinav Global School Dwarka