What Frequencies actually does (from store listing)
Find out what the frequency of a specific LPD / LPD 8 / PMR / CB (Citizen Band, 'normal' or UK) / UHF / PRS / FRS/GMRS / KDR / Marine VHF / AAR (American Assocation of Railroads) channel is and the CTCSS tone code of a subchannel.
Do you have a 2 meter / 70 cm band radio and want to communicate with someone with a Marine VHF / PMR / LPD / UHF / PRS / KDR / FRS/GMRS / AAR radio? Is that one also using 'subchannels'? This app is what you need!
Select which type you need and select the chann…
Find out what the frequency of a specific LPD / LPD 8 / PMR / CB (Citizen Band, 'normal' or UK) / UHF / PRS / FRS/GMRS / KDR / Marine VHF / AAR (American Assocation of Railroads) channel is and the CTCSS tone code of a subchannel.
Do you have a 2 meter / 70 cm band radio and want to communicate with someone with a Marine VHF / PMR / LPD / UHF / PRS / KDR / FRS/GMRS / AAR radio? Is that one also using 'subchannels'? This app is what you need!
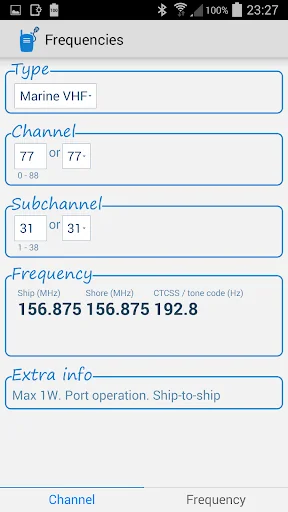
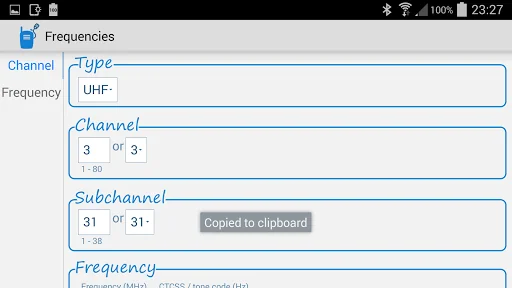
Select which type you need and select the channel and subchannel. The app calculates / converts the channel. The frequency (in MHz) and CTCSS frequency (in Hz) / tone code are then shown.
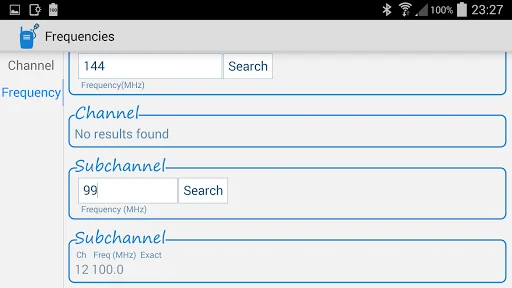
Or select the frequency (of a channel or subchannel) and the nearest channel will be shown, if it is nearby the given frequency. Select the tab 'frequency' at the bottom of the app to make use of this functionality.
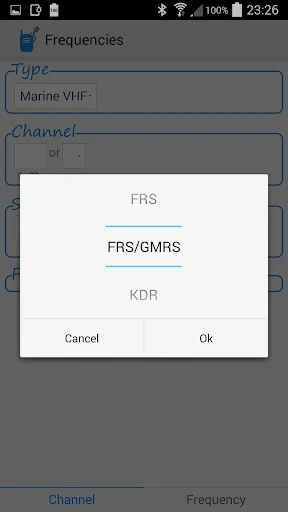
Possible types:
- PMR
- KDR
- LPD
- LPD8
- CB (Citizen Band)
- CB UK (Citizen Band UK)
- UHF (often used in Australia)
- PRS (often used in New Zeeland)
- FRS / GMRS
- FRS
- Marine VHF
- AAR (American Assocation of Railroads)
This is a version with ads. There is also a paid version of this app without ads. Ads and paid version are just to support the app development and subscription to the stores. Please tell me if you would like to have more features or supported radio types.
App icon by icons8.com / iconsdb.com
Idea by http://portoshop.nl
Comparable Android apps
The five apps in Tools with the closest revenue to Frequencies. Click any to see its detail page.
Each forecast combines App Store rating, ratings count, monetisation model, pricing tier, IAP signals and ad-supported flag.
The base estimate is then multiplied by a per-category scaling factor learned from apps with founder-verified MRR.
Every number on this page comes from public APIs and bumetric's own snapshot history.
Full methodology covers input variables, accuracy bands per category and how we treat apps without comparable anchors.
See also the live data on Frequencies's tracker page for current rating, reviews and snapshot timeline.
Building something similar? Get a free AI audit with $-revenue forecasts for every recommendation.

 Face Symmetry
 Update App for ODYS Tablet PCs
 Insignia Universal Remote
 Moj HoT - Slovenija
 GPS Coordinates