What Fuel & Costs actually does (from store listing)
Keep your fuel, service and other costs related to usage of your vehicle under control. This application allows you to keep track of all expenses of your car, motorcycle or other engine based vehicle, and provides related statistics and chart visualizations.
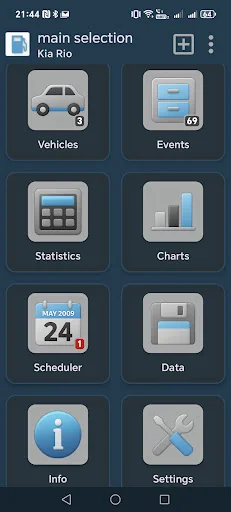
- keep track of multiple vehicles
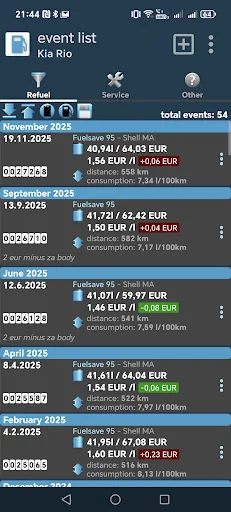
- keep track of refuels, service and other events with possibility to insert / update back in time
- scheduler for regular and future events based on ODO value and / or specific Date.
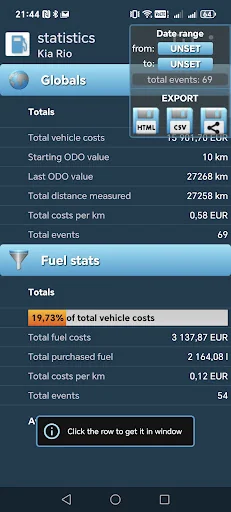
- statistics: fuel …
Keep your fuel, service and other costs related to usage of your vehicle under control. This application allows you to keep track of all expenses of your car, motorcycle or other engine based vehicle, and provides related statistics and chart visualizations.
- keep track of multiple vehicles
- keep track of refuels, service and other events with possibility to insert / update back in time
- scheduler for regular and future events based on ODO value and / or specific Date.
- statistics: fuel consumption, service costs, averages, min/max, ...
- statistics export: CSV / HTML
- charts: fuel price, consumption, monthly costs, costs by year, overall costs layout
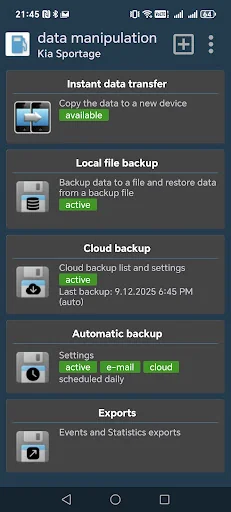
- data backup / restore from backup
All included in this small and well-arranged application. Expect more in future updates.
Comparable Android apps
The five apps in Finance with the closest revenue to Fuel & Costs. Click any to see its detail page.
Each forecast combines App Store rating, ratings count, monetisation model, pricing tier, IAP signals and ad-supported flag.
The base estimate is then multiplied by a per-category scaling factor learned from apps with founder-verified MRR.
Every number on this page comes from public APIs and bumetric's own snapshot history.
Full methodology covers input variables, accuracy bands per category and how we treat apps without comparable anchors.
See also the live data on Fuel & Costs's tracker page for current rating, reviews and snapshot timeline.
Building something similar? Get a free AI audit with $-revenue forecasts for every recommendation.

 Miio
Miio
 Virtual Trading App 2.0
 Addiko Mobile BiH
 Dext: Receipt Tracker
 MySantander Banking