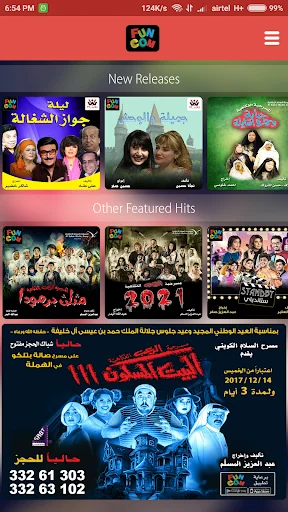
The application is an electronic library works in high quality that contains many different shows and programs. The application helps to improve the entertainment services for families by showing your favorite TV series, movies and theater shows.
Its interactive application proper for families, easy to use and fast with high quality. Give you a chance to open your profile and watch your favorite shows, write your comments and rate the shows. Also you can read our media newspaper that will ha…
The application is an electronic library works in high quality that contains many different shows and programs. The application helps to improve the entertainment services for families by showing your favorite TV series, movies and theater shows.
Its interactive application proper for families, easy to use and fast with high quality. Give you a chance to open your profile and watch your favorite shows, write your comments and rate the shows. Also you can read our media newspaper that will have many interested news.
Comparable Android apps
The five apps in Entertainment with the closest revenue to Funcom. Click any to see its detail page.
Each forecast combines App Store rating, ratings count, monetisation model, pricing tier, IAP signals and ad-supported flag.
The base estimate is then multiplied by a per-category scaling factor learned from apps with founder-verified MRR.
Every number on this page comes from public APIs and bumetric's own snapshot history.
Full methodology covers input variables, accuracy bands per category and how we treat apps without comparable anchors.
See also the live data on Funcom's tracker page for current rating, reviews and snapshot timeline.
Building something similar? Get a free AI audit with $-revenue forecasts for every recommendation.

 Hacked: Prank App
 Malayalam Keyboard
 Checkiday - Holiday Calendar
 Market Data
 Go3 Estonia