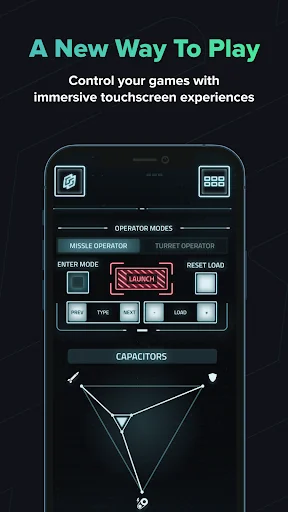
Control your games in a brand new way, with GameGlass Shards - immersive touchscreen interfaces on your phone and tablet.
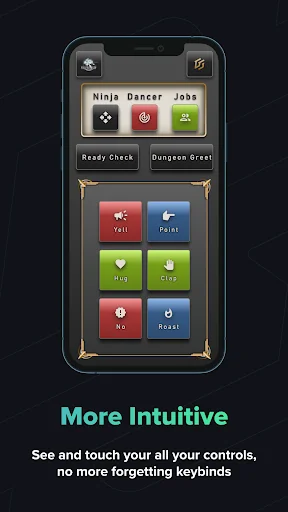
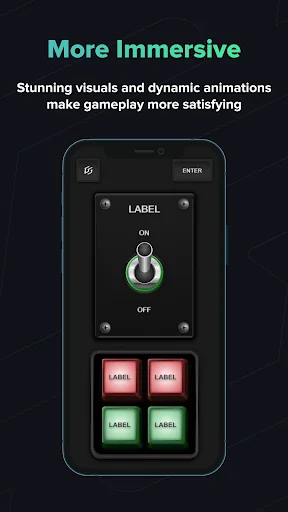
Shards let you use intuitive touch controls that include dynamic interactions and animations. Switches, buttons, toggles, sliders and more allow you to see your controls laid out clearly. Beautiful designs for a wide variety of game genres make them feel immersive.
Once you download the host application and create an account on our website gameglass.gg, you will be able…
Control your games in a brand new way, with GameGlass Shards - immersive touchscreen interfaces on your phone and tablet.
Shards let you use intuitive touch controls that include dynamic interactions and animations. Switches, buttons, toggles, sliders and more allow you to see your controls laid out clearly. Beautiful designs for a wide variety of game genres make them feel immersive.
Once you download the host application and create an account on our website gameglass.gg, you will be able to access our "Forge" editor which allows you to create, modify, and download other users shards.
Every Shard is customizable. With our flexible Action Manager you can assign keybinds, mouse clicks, delays, sound effects and more. You can even combine actions to create powerful macros and automations. Want a different layout, or more buttons - you can move, delete and add parts to create the perfect Shard for any game.
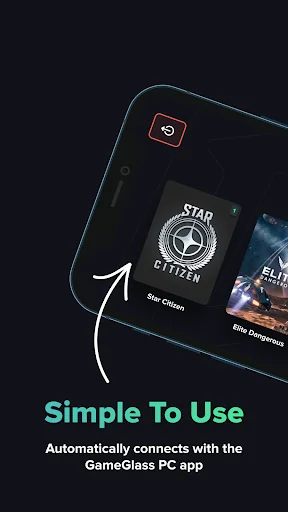
Setup is super easy - simply download Shards or create your own, then connect to the GameGlass desktop app. Commands are sent directly to your game via a secure, ultra low-latency connection using your own WiFi.
Comparable Android apps
The five apps in Tools with the closest revenue to GameGlass. Click any to see its detail page.
Each forecast combines App Store rating, ratings count, monetisation model, pricing tier, IAP signals and ad-supported flag.
The base estimate is then multiplied by a per-category scaling factor learned from apps with founder-verified MRR.
Every number on this page comes from public APIs and bumetric's own snapshot history.
Full methodology covers input variables, accuracy bands per category and how we treat apps without comparable anchors.
See also the live data on GameGlass's tracker page for current rating, reviews and snapshot timeline.
Building something similar? Get a free AI audit with $-revenue forecasts for every recommendation.

 Binary Translator
 Hidden Android settings
 CTEK Battery Sense
 TechniSat CONNECT
 Delta Altitude