What GamerGreen actually does (from store listing)
Welcome to our new and improved mobile app! You asked. We listened (and made it AWESOME).
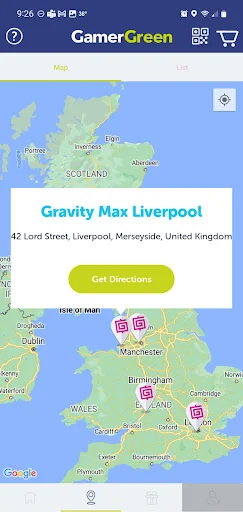
GamerGreen turns any participating Claw Machine or Arcade Game into a gamer arcade where you can win tickets (we call them G-Tickets) to redeem for cool prizes from within this very app.
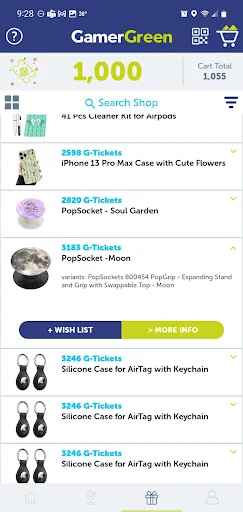
What kind of cool prizes I hear you ask? In the GamerGreen Store you’ll find iPads, TV’s, toys, games, home goods, plush animals, collectibles, candy and even a ride-on lawnmower (Dads, we know you love arcades too.…
Welcome to our new and improved mobile app! You asked. We listened (and made it AWESOME).
GamerGreen turns any participating Claw Machine or Arcade Game into a gamer arcade where you can win tickets (we call them G-Tickets) to redeem for cool prizes from within this very app.
What kind of cool prizes I hear you ask? In the GamerGreen Store you’ll find iPads, TV’s, toys, games, home goods, plush animals, collectibles, candy and even a ride-on lawnmower (Dads, we know you love arcades too.), just to name a few.
The way it works is simple.
1) Download the app.
2) Go to a participating claw machine or arcade game found in retail stores, restaurants, grocery stores, bowling alleys, movie theaters, malls, and other locations in your neighborhood. (By the way, you can reverse these first two steps.)
3) Win a prize with a secret GamerGreen code attached or take the QR code printed on the receipt from the arcade game you just dominated.
4) Enter or scan the code into the app.
5) Shabang! Those codes are now magically converted into G-Tickets. But wait, that’s not all!
6) Don’t forget about daily check ins! Head over to your favorite GG machine to cash in some G-Tickets just for showing up!
7) Want to win G-Tickets without going into a store? The daily challenge is for you. Every 24 hours play a FREE game in the app that allows you to rack up those G-Tickets! Sweet right?
Bank your G-Tickets. Surf the GamerGreen Store. Shop ‘til your heart’s content.
Congratulations are in order because you my friend, just joined the illustrious ranks of the GamerGreen Winners Hall of Fame (well actually you just won some G-Tickets you can buy cool stuff with, but it sounds better if you are in the hall of fame even though one doesn’t really exist yet)!
Thank you for downloading our app, we hope it brings you joy! Now hurry up and tell all your friends how funny we are and why they should download this app.
Comparable Android apps
The five apps in Arcade with the closest revenue to GamerGreen. Click any to see its detail page.
Each forecast combines App Store rating, ratings count, monetisation model, pricing tier, IAP signals and ad-supported flag.
The base estimate is then multiplied by a per-category scaling factor learned from apps with founder-verified MRR.
Every number on this page comes from public APIs and bumetric's own snapshot history.
Full methodology covers input variables, accuracy bands per category and how we treat apps without comparable anchors.
See also the live data on GamerGreen's tracker page for current rating, reviews and snapshot timeline.
Building something similar? Get a free AI audit with $-revenue forecasts for every recommendation.


 No one can tap 1 trillion time
 Creepy Clicker
 ふつうのコイン落とし コインゲーム メダルゲームで暇つぶし
 Insect Smasher: Ant & Beetle
 Defend the Castle