We at Geek Shop are passionate tech enthusiasts who enjoy sharing the latest gadgets with people all around the world. We provide you a massive selection of products and offer unbeatable prices from top gadgets stores. Smartphones, laptops, TV Boxes, Smart Wearables, and Drones are amongst the most popular products on our App; but there are many other amazing gadgets you can find here on Geek Shop. From big brands to trendy items we have made your search that much easier. So check out our incred…
We at Geek Shop are passionate tech enthusiasts who enjoy sharing the latest gadgets with people all around the world. We provide you a massive selection of products and offer unbeatable prices from top gadgets stores. Smartphones, laptops, TV Boxes, Smart Wearables, and Drones are amongst the most popular products on our App; but there are many other amazing gadgets you can find here on Geek Shop. From big brands to trendy items we have made your search that much easier. So check out our incredible products now!
Get what you like at Up to 90% OFF and compare all gadgets prices from one single app.
Shop All & Top geeks, gadgets, electronics, accessories, etc Sites without Leaving One App!
You will get notifications about discounts, coupons, and special deals and enjoy free shipping on many products.
Shop now for 5k+ famous Chinese brands and top suppliers, including over 1,000 top brands like Xiaomi, Lenovo, Huawei. Our geek shopping app offers you the best stores to shop from China for over 1 million products online, more than 1,000 new arrivals per day, providing plentiful shopping options for users.
Benefit from cost-efficient delivery service covering 200+ countries and regions, most of which enjoy free door-to-door delivery. Some stores offer you free delivery on all orders.
Benefit from all the website's features and complete your purchases securely and easily.
Find great gadgets, price & service. Check out daily deals, clearance sales, and coupon savings.
Geek Shop App is your prime source for thousands of products, curated from the highly-rated brands that you love. We bring you all the best products and top brands, so whether you’re looking for that new Garmin fitness watch or the best camping & hiking backpacks for your weekend away, we have it all at outlet prices & free same-day shipping.
We, source only the best consumer goods and ensure the highest quality possible, streamline the buying and payment process making it as easy as possible, help you discover products and manufacturers in China, deliver goods to our customers all over the world with speed and precision.
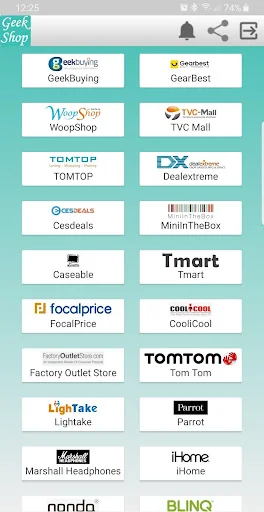
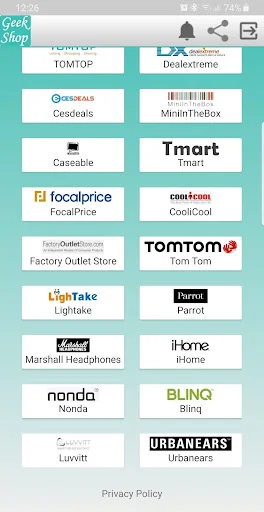
Shop now from top trusted and tested stores from one single app:
GeekBuying
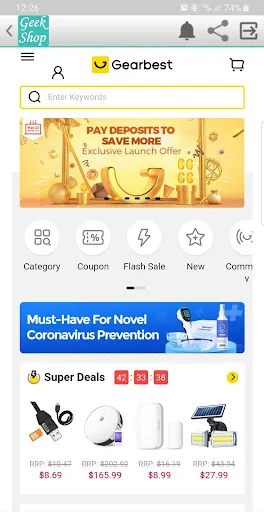
GearBest
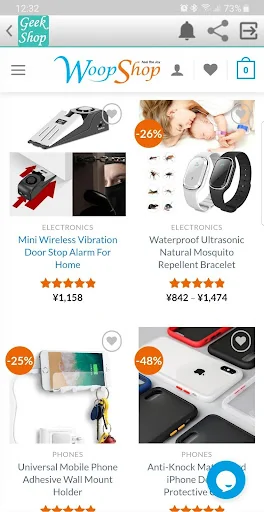
WoopShop
TVC Mall
TOMTOP
Dealextreme
Cesdeals
MiniInTheBox
Caseable
Tmart
FocalPrice
CooliCool
Factory Outlet Store
Tom Tom
Lightake
Parrot
Marshall Headphones
iHome
Nonda
Blinq
Luvvitt
Urbanears
Comparable Android apps
The five apps in Shopping with the closest revenue to Geek Shop. Click any to see its detail page.
Each forecast combines App Store rating, ratings count, monetisation model, pricing tier, IAP signals and ad-supported flag.
The base estimate is then multiplied by a per-category scaling factor learned from apps with founder-verified MRR.
Every number on this page comes from public APIs and bumetric's own snapshot history.
Full methodology covers input variables, accuracy bands per category and how we treat apps without comparable anchors.
See also the live data on Geek Shop's tracker page for current rating, reviews and snapshot timeline.
Building something similar? Get a free AI audit with $-revenue forecasts for every recommendation.

 BidALot Coin Auction
 アンテシュクレ 下着専門店公式アプリ
 IFA.JD
 Zweibruecken Fashion Outlet
 Verdecora: Todo para tu jardín