1.2M Assets Tracked Updated 6 min ago Revenue Forecasts
Create Account Sign In
Home
Get Rich! 3D icon

How much does Get Rich! 3D earn?

Android app from Supersonic Studios LTD · Casual

ML forecast ★ 3.8 · 33K Free

~1.2K/mo

ML revenue forecast. Calibrated against 26282 apps in this category.

Confidence band
±15%
High — many comparable apps with verified data

At a glance

What the app looks like

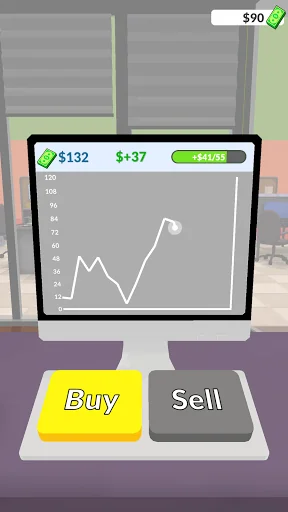
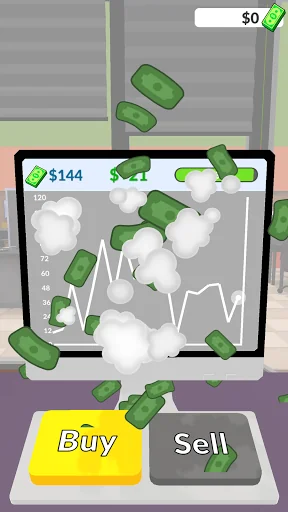
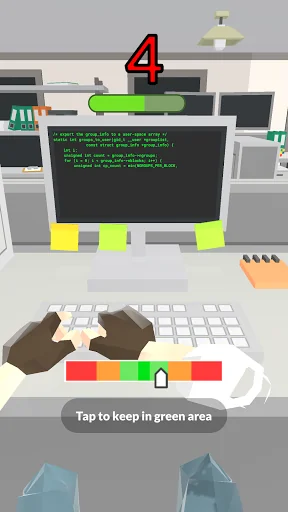
Live screenshots from the Play Store, captured by our snapshot worker. Tap any image to enlarge.

Get Rich! 3D screenshot 1 Get Rich! 3D screenshot 2 Get Rich! 3D screenshot 3 Get Rich! 3D screenshot 4

Get Rich! 3D's revenue trajectory

Forecast revenue from snapshot history. Last 1 months.

Where Get Rich! 3D sits in Casual

Revenue distribution of 26282 comparable apps. Get Rich! 3D highlighted.

Get Rich! 3D vs comparable apps

Revenue trajectory side-by-side. Bold = Get Rich! 3D, ghosted = peers.

App spec

Version
1.4.0
Last update
Apr 13, 2026
Launched
Jan 09, 2021
Price
Free
Monetization
Free

What Get Rich! 3D actually does (from store listing)

Buy and sell, it is that easy to make money. Trade on stock market and get rich to buy your dream car, a beautiful house, a boat and even a jet plane! Have your own watch and ring collection. Buy from the lowest price you can and sell it when it goes high! Reach your daily profit target. Play bonus levels to steal trade secrets and more...

Comparable Android apps

The five apps in Casual with the closest revenue to Get Rich! 3D. Click any to see its detail page.

AppRevenueRatingRatings
Flower Girl-Crazy Wedding Day icon Flower Girl-Crazy Wedding Day 1.2K ★ 4.3 14K
Drill Evolution icon Drill Evolution 1.2K ★ 3.7 16K
Masala Madness: Cooking Games icon Masala Madness: Cooking Games 1.2K ★ 4.4 14K
Fashion Designer Dress Maker 2 icon Fashion Designer Dress Maker 2 1.2K ★ 3.8 17K
마이리틀셰프: 레스토랑 카페 타이쿤 경영 요리 게임 icon 마이리틀셰프: 레스토랑 카페 타이쿤 경영 요리 게임 1.2K ★ 4.3 20K
Own Get Rich! 3D? Replace our estimate with your real revenue via Stripe Connect or ASC. Get a public Verified badge.
Claim & verify →

How we calculated this

Each forecast combines App Store rating, ratings count, monetisation model, pricing tier, IAP signals and ad-supported flag. The base estimate is then multiplied by a per-category scaling factor learned from apps with founder-verified MRR. Every number on this page comes from public APIs and bumetric's own snapshot history.

Full methodology covers input variables, accuracy bands per category and how we treat apps without comparable anchors. See also the live data on Get Rich! 3D's tracker page for current rating, reviews and snapshot timeline.

Building something similar? Get a free AI audit with $-revenue forecasts for every recommendation.
Audit my app →