Android app
from EDP CITY GOVERNMENT OF MANILA
· Finance
ML forecast★ 2.9 · 2KFree
~264/mo
ML revenue forecast.
Calibrated against 36598 apps in this category.
Confidence band
±15%
High — many comparable apps with verified data
At a glance
Earns 1.72× more than the category median (154/mo).
Ranks #9,169 of 36,598 in Finance (top 25.1% by revenue).
Launched Jan 07, 2020 · last updated Apr 28, 2025.
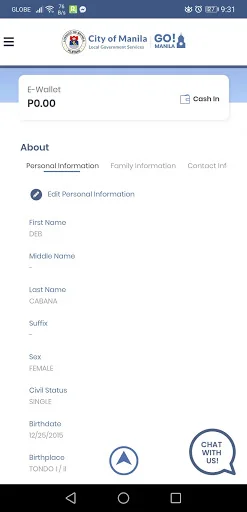
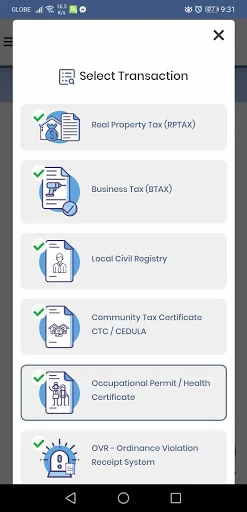
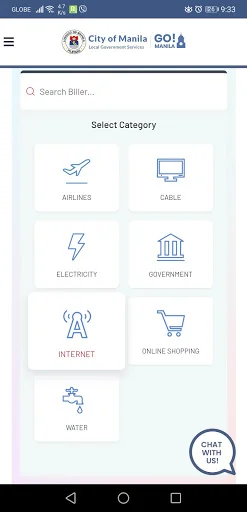
What the app looks like
Live screenshots from the Play Store, captured by our snapshot worker. Tap any image to enlarge.
GO Manila's revenue trajectory
Forecast revenue from snapshot history. Last 1 months.
Where GO Manila sits in Finance
Revenue distribution of 36598 comparable apps. GO Manila highlighted.
GO Manila vs comparable apps
Revenue trajectory side-by-side. Bold = GO Manila, ghosted = peers.
App spec
Version
2.2.14
Last update
Apr 28, 2025
Launched
Jan 07, 2020
Price
Free
Monetization
Free
What GO Manila actually does (from store listing)
GO! MANILA Mobile App - Official mobile app of the City Government of Manila that aims to provide fast, effective and convenient manner of various services to the public. A more secure and cost-effective means to access a full range of payments and financial services that will reach not only the constituents of the City but globally.
The mobile application has the following features:
- City of Manila’s Real Property and Business Tax Payments;
- Wide range of facilities for payment of bil…
GO! MANILA Mobile App - Official mobile app of the City Government of Manila that aims to provide fast, effective and convenient manner of various services to the public. A more secure and cost-effective means to access a full range of payments and financial services that will reach not only the constituents of the City but globally.
The mobile application has the following features:
- City of Manila’s Real Property and Business Tax Payments;
- Wide range of facilities for payment of bills for government and private entities;
- E-Wallet for loading, payment, sending and receiving of funds;
Comparable Android apps
The five apps in Finance with the closest revenue to GO Manila. Click any to see its detail page.
Each forecast combines App Store rating, ratings count, monetisation model, pricing tier, IAP signals and ad-supported flag.
The base estimate is then multiplied by a per-category scaling factor learned from apps with founder-verified MRR.
Every number on this page comes from public APIs and bumetric's own snapshot history.
Full methodology covers input variables, accuracy bands per category and how we treat apps without comparable anchors.
See also the live data on GO Manila's tracker page for current rating, reviews and snapshot timeline.
Building something similar? Get a free AI audit with $-revenue forecasts for every recommendation.


 Santander Consumer Perú
 YSwinner
 BEN - Billetera BNP
 Scotia Pagos
 Grenada Co-operative Bank