What Hardboiled actually does (from store listing)
In a world ravaged by the devastating aftermath of humanity's self-destruction, survival is the ultimate goal. The cataclysmic blast unleashed chaos, leaving only remnants of abandoned towns and cities engulfed in the aftermath of radiation and disease. Among the survivors is Max, determined to piece together the fragments of his shattered life. However, his journey takes an unexpected turn after a few stolen car parts set off a chain of events that tests his resolve.
Embark on a gripping adv…
In a world ravaged by the devastating aftermath of humanity's self-destruction, survival is the ultimate goal. The cataclysmic blast unleashed chaos, leaving only remnants of abandoned towns and cities engulfed in the aftermath of radiation and disease. Among the survivors is Max, determined to piece together the fragments of his shattered life. However, his journey takes an unexpected turn after a few stolen car parts set off a chain of events that tests his resolve.
Embark on a gripping adventure as Max navigates treacherous landscapes, encountering desperate factions vying for control. As he searches for a new home, conflicts arise, forcing him to confront the delicate balance between justice and survival. Will he reclaim the stolen parts and forge his own path, helping those in need along the way? Or will he resort to ruthless tactics, leaving a trail of destruction in his wake? The choice is yours as Max embraces his role as a harbinger of justice.
Features:
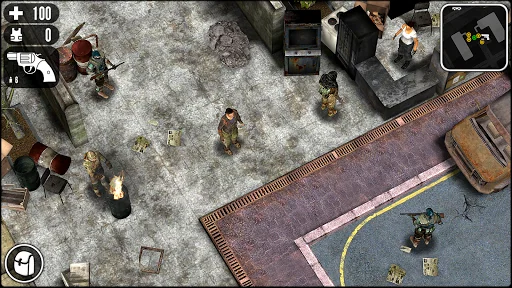
• Explore a desolate and perilous town, teeming with mysteries and dangers at every turn.
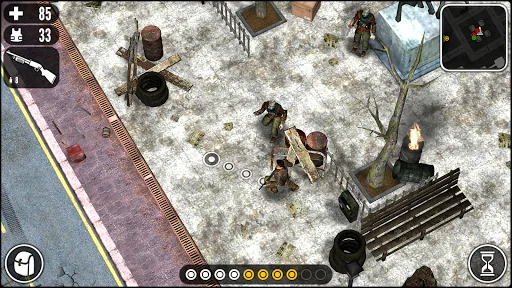
• Engage in strategic turn-based combat, utilizing your wits and tactics to outsmart adversaries.
• Immerse yourself in atmospheric graphics and immersive sound design, capturing the bleak essence of a post-apocalyptic world.
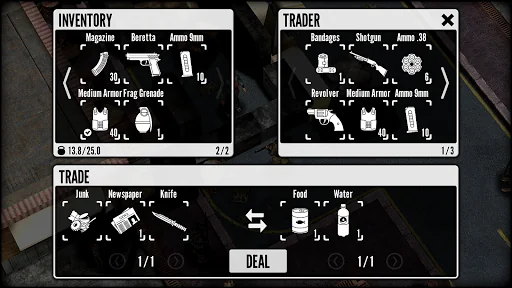
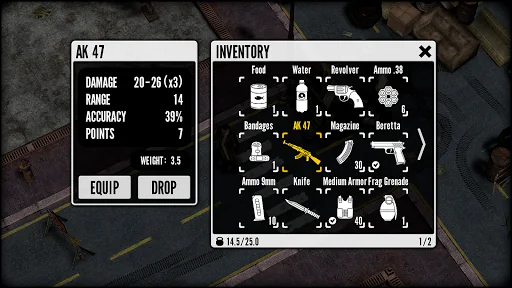
• Arm yourself with an arsenal of diverse weapons and scavenge for valuable loot to enhance your chances of survival.
• Shape Max's destiny through a dynamic reputation system, allowing you to choose between acts of compassion or acts of ruthlessness.
• Develop Max's skills and attributes through a robust skill point stat system, customizing his abilities to suit your playstyle.
• Enjoy an uninterrupted gaming experience with no intrusive ads or in-app purchases.
Dive into this gripping post-apocalyptic tale, where your decisions shape the course of Max's journey towards redemption or chaos. Will you navigate the remnants of humanity with empathy and compassion, or will you succumb to the darkness that lurks within? The future lies in your hands.
Good luck and have fun!
Comparable Android apps
The five apps in Role Playing with the closest revenue to Hardboiled. Click any to see its detail page.
Each forecast combines App Store rating, ratings count, monetisation model, pricing tier, IAP signals and ad-supported flag.
The base estimate is then multiplied by a per-category scaling factor learned from apps with founder-verified MRR.
Every number on this page comes from public APIs and bumetric's own snapshot history.
Full methodology covers input variables, accuracy bands per category and how we treat apps without comparable anchors.
See also the live data on Hardboiled's tracker page for current rating, reviews and snapshot timeline.
Building something similar? Get a free AI audit with $-revenue forecasts for every recommendation.

 DRAGON QUEST IV
 Neverwinter Nights: Enhanced
 Star Traders: Frontiers
 Heroes of Steel RPG Elite
 DRAGON QUEST III