Live screenshots from the Play Store, captured by our snapshot worker. Tap any image to enlarge.
Welcome to Hay Day, the fun farm simulator game! Build a farm, go fishing, raise animals, and explore the Valley. Farm with friends and decorate your own slice of country paradise.
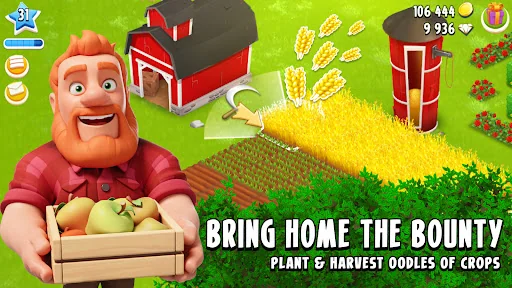
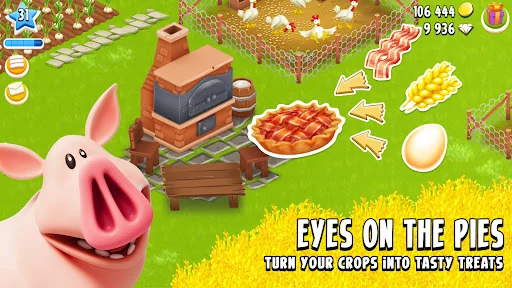
Farming has never been easier! Grow crops like wheat and corn in this farm simulator, and even though it never rains, they never die. Harvest and replant seeds to multiply crops, then make goods to sell. Befriend animals like chickens, pigs, and cows as you expand and grow! Feed your animals to produce eggs, bacon,…
Read full description →
Welcome to Hay Day, the fun farm simulator game! Build a farm, go fishing, raise animals, and explore the Valley. Farm with friends and decorate your own slice of country paradise.
Farming has never been easier! Grow crops like wheat and corn in this farm simulator, and even though it never rains, they never die. Harvest and replant seeds to multiply crops, then make goods to sell. Befriend animals like chickens, pigs, and cows as you expand and grow! Feed your animals to produce eggs, bacon, dairy, and more to trade with neighbors or fill truck orders for coins. This farming simulator is perfect for players who love animals, farming, and trade!
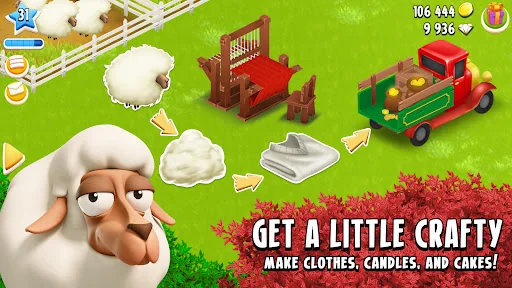
Become a farm tycoon with a thriving business. Expand with a Bakery, BBQ Grill or Sugar Mill to sell more goods. Grow your farm simulator empire like a true tycoon. Build a Sewing Machine and Loom to create cute outfits or a Cake Oven to bake delicious cakes. The opportunities are endless in this farming game!
Customize your farm and decorate with a wide variety of items. Decorate your farm simulator with unique touches that make farming fun. Build your dream farm step by step, raising animals, farming crops, and designing your land.
Trade and sell items in this farm simulator by truck or steamboat. Trade crops, fish, and fresh goods from your animals, and share resources to gain experience and coins. Become a successful farming tycoon with your own Roadside Shop. In this farm simulator, trading is key: trade, farm, build, fish, and decorate to rise as a tycoon!
Expand your farm simulator experience and play with friends. Join a neighborhood, or create your own with up to 30 players. Exchange tips and help each other create amazing farms! Play with friends in this farming simulator to build, trade, and fish together.
Hay Day Features:
Peaceful farm simulator
- Farming is easy on this ranch simulator – get plots, grow crops, harvest, repeat!
- Customize your family farm & make your own slice of paradise
- Trade and sell – become a farm tycoon!
Crops to grow & harvest:
- Crops like wheat and corn never die in this farm simulator
- Harvest and replant, or use crops like wheat to make bread
- Trade and sell your crops to be a farming legend!
Raise animals in-game:
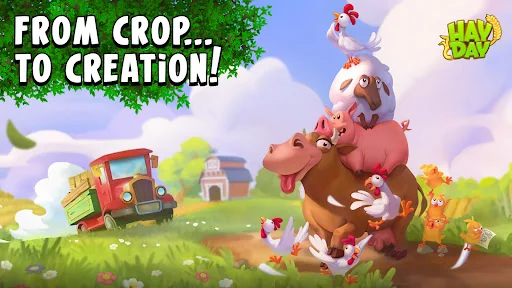
- Meet quirky animals!
- Rear chickens, horses, cows, and more
- Pets like puppies, kittens, and bunnies can be added to your farm
- Raise animals, farm crops, and build your farming adventure as the ultimate farm tycoon!
Places to visit:
- Fishing Lake: Repair your dock and cast your lure to fish
- Town: Repair the train station and fulfill visitor orders
- Valley: Play with friends in different seasons and events
- Fishing is key to your farming adventure – fish, farming, and trade all in one game.
Play with Friends & Neighbors:
- Trade crops and fresh goods
- Share tips with friends and help them complete trades
- Compete in weekly neighborhood derby events to win rewards!
- Farming is more fun with friends!
Farming simulator:
- Pack your farm with crops, animals, and fun
- Go fishing, catch fish, and add new rewards to your farm
- Decorate your land to create the ultimate farming simulator experience
Download now and build your dream farm in the most fun farming simulator!
Neighbor, are you having problems? Visit https://supercell.helpshift.com/a/hay-day/?l=en
or contact us in-game by going to Settings > Help and Support.
Under our Terms of Services and Privacy Policy, Hay Day is allowed for download and play only for persons 13 years of age or over.
PLEASE NOTE! Hay Day is free to download and install. However, some game items can also be purchased for real money. If you do not want to use this feature, please set up password protection for purchases in the settings of your Google Play Store app. A network connection is also required.
Privacy Policy:
http://www.supercell.net/privacy-policy/
Terms of Service:
http://www.supercell.net/terms-of-service/
Parent's Guide:
http://www.supercell.net/parents/
The five apps in Casual with the closest revenue to Hay Day. Click any to see its detail page.
Each forecast combines App Store rating, ratings count, monetisation model, pricing tier, IAP signals and ad-supported flag.
The base estimate is then multiplied by a per-category scaling factor learned from apps with founder-verified MRR.
Every number on this page comes from public APIs and bumetric's own snapshot history.

 My Talking Angela
 Hidden Folks
 My PlayHome Stores
 Mega Mall Story
 Township