What Heatmap: Finanz-Visualisierung actually does (from App Store listing)
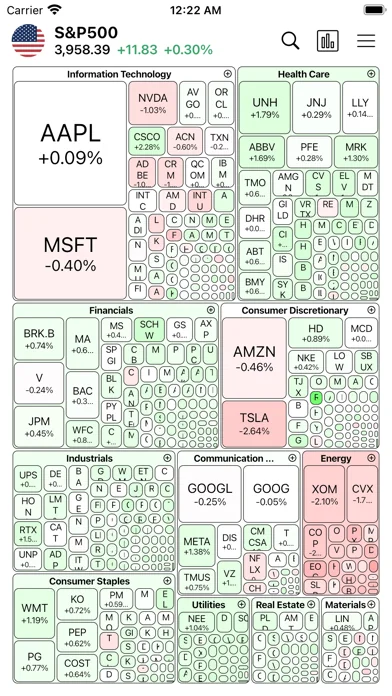
◎ See global stock trends at a glance with market cap and trading value heatmaps.
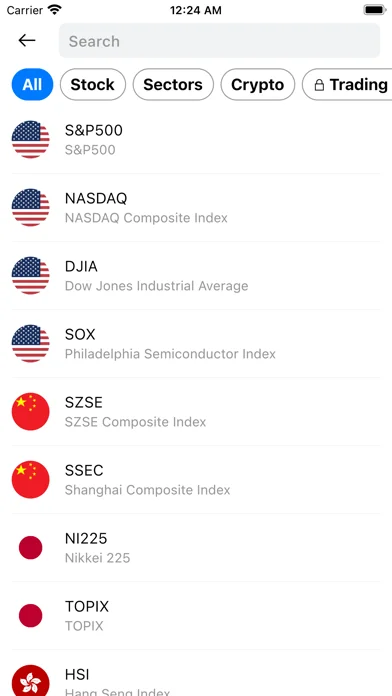
• Supports 20 markets including the US, China, Japan, Hong Kong, and Korea.
• View market cap heatmaps across multiple periods: 1D, 7D, 14D, 30D, 90D, 6M, and 1Y.
• Top-volume stocks from major exchanges are also visualized as a treemap.
◎ Sector Treemap
• Compare global company values across 35+ sectors including Automakers, Semiconductors, Airlines, Banks, Healthcare, Video Games, and E-Commerce.
◎ Dividend Hea…
◎ See global stock trends at a glance with market cap and trading value heatmaps. • Supports 20 markets including the US, China, Japan, Hong Kong, and Korea. • View market cap heatmaps across multiple periods: 1D, 7D, 14D, 30D, 90D, 6M, and 1Y. • Top-volume stocks from major exchanges are also visualized as a treemap.
◎ Sector Treemap • Compare global company values across 35+ sectors including Automakers, Semiconductors, Airlines, Banks, Healthcare, Video Games, and E-Commerce.
◎ Dividend Heatmap (NEW) • Visualize dividend yields and dividend growth for S&P500 stocks. • Per-stock dividend history charts included.
◎ Crypto Heatmap • Heatmaps by market cap and trading volume, plus 12 categories including DeFi, Memes, NFT, and Metaverse.
◎ AI Stock Insights (NEW) • Ask the AI chatbot anything about your watchlist. • Catch up on the latest news and briefings for your watchlist at a glance.
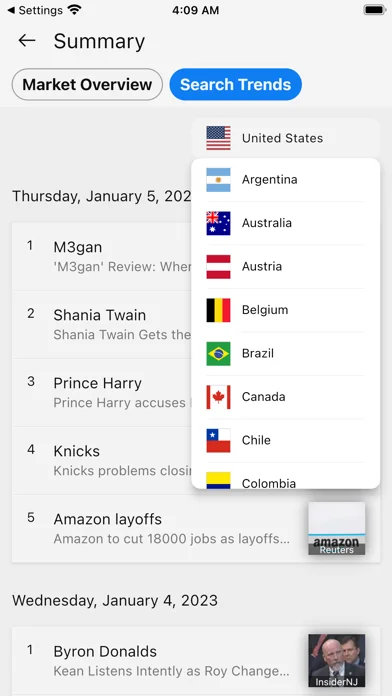
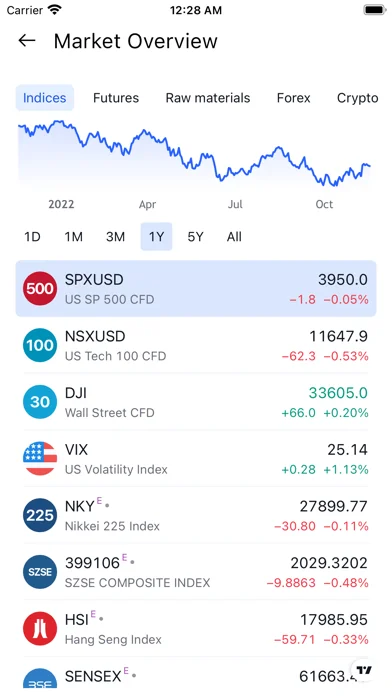
◎ Market Overview & Macro News • Track major indices, futures, commodities, and FX rates with mini charts in one view. • Curated political and economic news plus trending YouTube videos by country. • Get push notifications with key info on major indices after market close.
Terms of Use: https://www.apple.com/legal/internet-services/itunes/dev/stdeula/ Privacy Policy: https://softable.kr/privacy-policy/heatmap
🆕 What's new · v3.3.1
Usability improvements and bug fixes
Comparable iOS apps
The five apps in Finance with the closest revenue to Heatmap: Finanz-Visualisierung. Click any to see its detail page.
Each forecast combines App Store rating, ratings count, monetisation model, pricing tier, IAP signals and ad-supported flag.
The base estimate is then multiplied by a per-category scaling factor learned from apps with founder-verified MRR.
Every number on this page comes from public APIs and bumetric's own snapshot history.
Full methodology covers input variables, accuracy bands per category and how we treat apps without comparable anchors.
See also the live data on Heatmap: Finanz-Visualisierung's tracker page for current rating, reviews and snapshot timeline.
Building something similar? Get a free AI audit with $-revenue forecasts for every recommendation.

 富途牛牛 - 實時報價 股票資訊 投資社區 AI投資分析工具
 OTC Network
 CashTrails+: Personal Finance
 CashSync+PRO: Expense tracking
 YieldGimp