What Heroes Inc! actually does (from store listing)
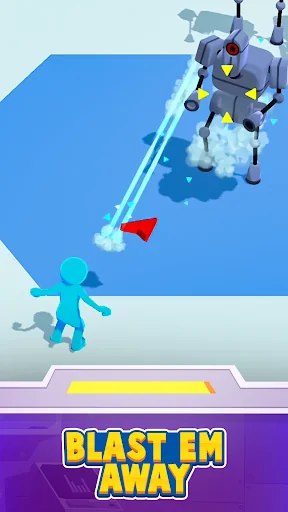
Craft the greatest Heroes in history and save the world! Create new super powers and build your alliance of heroes to face the attacking army of evil robots. The battles will be epic, the enemies are endless, and your heroes are greatest in the world!
An army of alien robots has attacked earth, the people need your help! The invaders are numerous, they demolish buildings with their mighty fighting mechs and wield an vast arsenal of laser weapons. Unleashed on the world, humanity stands no ch…
Craft the greatest Heroes in history and save the world! Create new super powers and build your alliance of heroes to face the attacking army of evil robots. The battles will be epic, the enemies are endless, and your heroes are greatest in the world!
An army of alien robots has attacked earth, the people need your help! The invaders are numerous, they demolish buildings with their mighty fighting mechs and wield an vast arsenal of laser weapons. Unleashed on the world, humanity stands no chance against this evil… can you save them from this doom?
Build your laboratory, experiment and create new powers! unlock advanced technology and develop new abilities to use in the war against evil. There are hundreds of powers to discover, will you collect them all?
Even the most powerful super hero can be overwhelmed, out maneuvered, and defeated… You must train your heroes, teach them to use their new powers! Unlock their unique skills and watch them decimate their foes!
Game Features
Craft super heroes - there are hundreds to discover!
Fight as your new heroes - unleash their powers upon the battlefield.
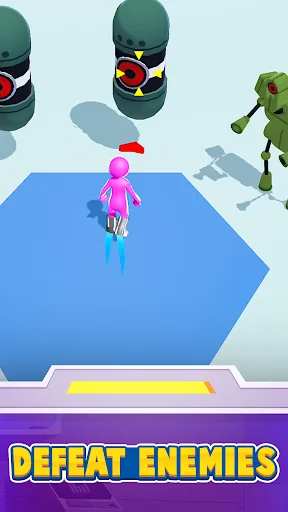
The enemy comes in many different forms - can you defeat their army?
Destroy the enemies leadership - Duke it out in epic Boss fights!
Collect new elements to unlock new super powers.
Build the best hero lab in the world - forge the greatest alliance of heroes ever seen!
Visit https://lionstudios.cc/contact-us/ if have any feedback, need help on beating a level or have any awesome ideas you would like to see in the game!
From the Studio that brought you Mr. Bullet, Happy Glass, Ink Inc and Love Balls!
Follow us to get news and updates on our other Award Winning titles;
https://lionstudios.cc/
Facebook.com/LionStudios.cc
Instagram.com/LionStudioscc
Twitter.com/LionStudiosCC
Youtube.com/c/LionStudiosCC
Comparable Android apps
The five apps in Arcade with the closest revenue to Heroes Inc!. Click any to see its detail page.
Each forecast combines App Store rating, ratings count, monetisation model, pricing tier, IAP signals and ad-supported flag.
The base estimate is then multiplied by a per-category scaling factor learned from apps with founder-verified MRR.
Every number on this page comes from public APIs and bumetric's own snapshot history.
Full methodology covers input variables, accuracy bands per category and how we treat apps without comparable anchors.
See also the live data on Heroes Inc!'s tracker page for current rating, reviews and snapshot timeline.
Building something similar? Get a free AI audit with $-revenue forecasts for every recommendation.


 Hoop Stars
 Hot Dog Bush
 Gibbets:Bow Master!Arrow Games
 Slime vs. Mushroom2
 KoGaMa