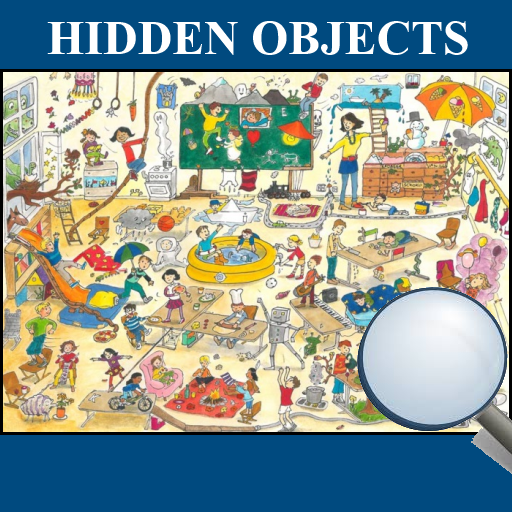
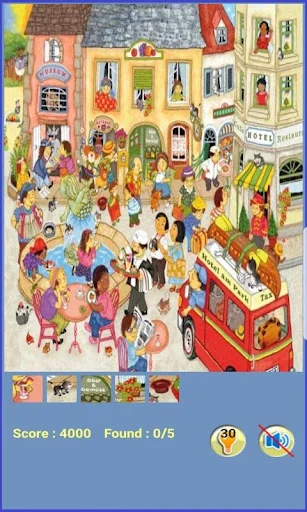
What Hidden Objects 3 actually does (from store listing)
Observe, locate and find all the hidden objects in this free Hidden Object games
while you uncover dozens of images on the way.
Hidden Objects is a challenging brain trainer game where you have to search
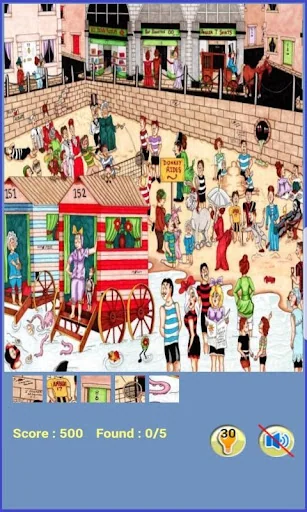
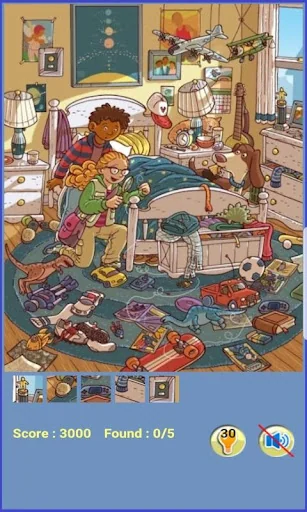
and locate the 5 hidden objects in each image.
Take your time, observe, find and spot the hidden objects, as this is not that type of hidden object games where you are rushed to detect all the hidden objects.
Uncover, detect and spot the concealed 300 hidden objects in 60 high quality ima…
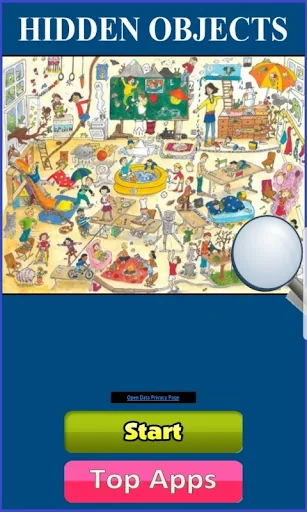
Observe, locate and find all the hidden objects in this free Hidden Object games
while you uncover dozens of images on the way.
Hidden Objects is a challenging brain trainer game where you have to search
and locate the 5 hidden objects in each image.
Take your time, observe, find and spot the hidden objects, as this is not that type of hidden object games where you are rushed to detect all the hidden objects.
Uncover, detect and spot the concealed 300 hidden objects in 60 high quality images.
FEATURES:
• 60 Different high quality colorful images
• 300 Hidden Objects to detect & locate
• Play at your own pace with No Time Limit
• Cannot spot & find a hidden object? Use some hints to detect it
• Completely FREE and without any in-app purchases
Please leave a review if you like our find objects games. Thanks!
Comparable Android apps
The five apps in Puzzle with the closest revenue to Hidden Objects 3. Click any to see its detail page.
Each forecast combines App Store rating, ratings count, monetisation model, pricing tier, IAP signals and ad-supported flag.
The base estimate is then multiplied by a per-category scaling factor learned from apps with founder-verified MRR.
Every number on this page comes from public APIs and bumetric's own snapshot history.
Full methodology covers input variables, accuracy bands per category and how we treat apps without comparable anchors.
See also the live data on Hidden Objects 3's tracker page for current rating, reviews and snapshot timeline.
Building something similar? Get a free AI audit with $-revenue forecasts for every recommendation.
 GeoBlocksX
 Bubble Lines
 Matchica
 Find differences - game
 Car Pick Forklift