Homeroom is an easy way to share what's happening in your classroom with your students' parents. Upload your photos safely to private classroom albums only parents and teachers can see, away from social media and the internet.
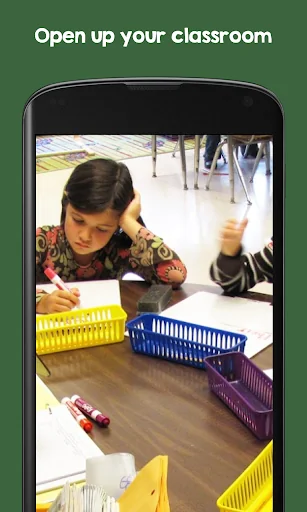
Open up your classroom:
• Show & tell: Parents can see all the fun their kids are having
• Simple: Share photos quickly and easily
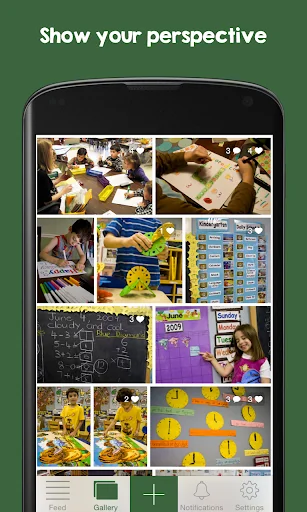
Show your perspective:
• Break it down: Build an album for each class
• Collaborate: Anyone who teaches a class can add to its alb…
Homeroom is an easy way to share what's happening in your classroom with your students' parents. Upload your photos safely to private classroom albums only parents and teachers can see, away from social media and the internet.
Open up your classroom:
• Show & tell: Parents can see all the fun their kids are having
• Simple: Share photos quickly and easily
Show your perspective:
• Break it down: Build an album for each class
• Collaborate: Anyone who teaches a class can add to its album
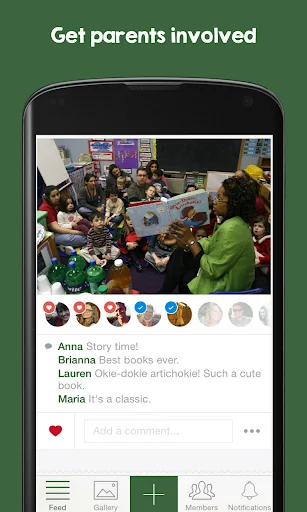
Get parents involved:
• Start conversations: Parents can add comments and like photos
• Stay notified: Everyone gets alerts when new things appear
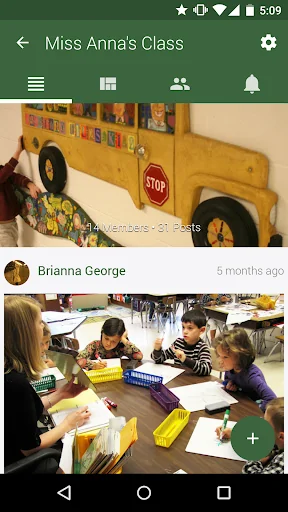
How it works:
1. Create: Make one or more albums for your homeroom
2. Invite: Send invitations to your kids' parents
3. Share: Post photos and videos of your students learning
Homeroom helps you connect with parents:
• Keep it private: Photos, videos, and comments are only visible to the people you invite
• Apps for everyone: Access Homeroom through gorgeous mobile apps and the web
• Relevant notifications: Parents only get notifications for their kids' classes
Permissions Requested
• Network Access: We use network access to communicate with our servers for just about everything in the app including uploading photos, videos, comments, etc.
• Location: We use location when you choose to post where you are, but we won't use your location otherwise.
• Contacts: We show contacts you can invite to when building an album, and we only send invitations to people you choose to follow along. Your contacts will not be uploaded to our server.
• Write External Storage: We use this permission if you choose to download photos from other members of your album.
Comparable Android apps
The five apps in Social with the closest revenue to Homeroom. Click any to see its detail page.
Each forecast combines App Store rating, ratings count, monetisation model, pricing tier, IAP signals and ad-supported flag.
The base estimate is then multiplied by a per-category scaling factor learned from apps with founder-verified MRR.
Every number on this page comes from public APIs and bumetric's own snapshot history.
Full methodology covers input variables, accuracy bands per category and how we treat apps without comparable anchors.
See also the live data on Homeroom's tracker page for current rating, reviews and snapshot timeline.
Building something similar? Get a free AI audit with $-revenue forecasts for every recommendation.

 Моя вигода
 Nri Marriage Bureau
 Sankalan
 Cute Love Stickers
 Sharadotsav