What Hoop Group actually does (from store listing)
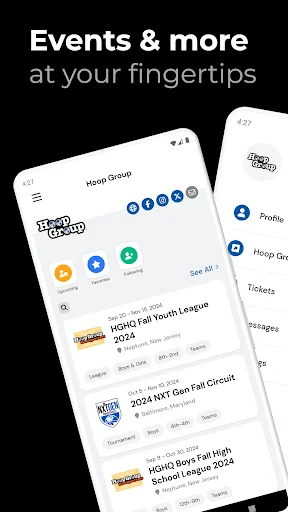
The Hoop Group app is your all-encompassing guide for sporting events, meticulously crafted to cater to the needs of team and college coaches, media, players, parents, and fans. Designed to bring every essential aspect of the event to your fingertips, this platform ensures you stay connected and well-informed.
Key Features:
• Quick team search and user-friendly shortcuts.
• Up-to-the-minute schedules to keep you on track.
• Live standings and brackets for real-time updates.
• Immediate …
The Hoop Group app is your all-encompassing guide for sporting events, meticulously crafted to cater to the needs of team and college coaches, media, players, parents, and fans. Designed to bring every essential aspect of the event to your fingertips, this platform ensures you stay connected and well-informed.
Key Features:
• Quick team search and user-friendly shortcuts.
• Up-to-the-minute schedules to keep you on track.
• Live standings and brackets for real-time updates.
• Immediate game notifications so you never miss a beat.
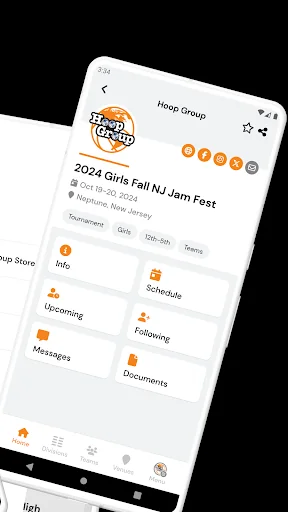
• Venue directions for easy navigation.
• Access to team rosters and live results with box scores (when available), all at your fingertips.
• Essential event documents, messages, and contact details for complete guidance.
• Information on event sponsors for additional insights.
With the app, every detail of the event is conveniently at your fingertips, ensuring an immersive and comprehensive experience for everyone involved.
Comparable Android apps
The five apps in Sports with the closest revenue to Hoop Group. Click any to see its detail page.
Each forecast combines App Store rating, ratings count, monetisation model, pricing tier, IAP signals and ad-supported flag.
The base estimate is then multiplied by a per-category scaling factor learned from apps with founder-verified MRR.
Every number on this page comes from public APIs and bumetric's own snapshot history.
Full methodology covers input variables, accuracy bands per category and how we treat apps without comparable anchors.
See also the live data on Hoop Group's tracker page for current rating, reviews and snapshot timeline.
Building something similar? Get a free AI audit with $-revenue forecasts for every recommendation.

 drillstars - Soccer Coach
 MHC Leusden
 Bora Palmeiras
 HSG Würm-Mitte
 Lincoln Marathon