ML revenue forecast.
Calibrated against 21896 apps in this category.
Confidence band
±15%
High — many comparable apps with verified data
At a glance
Tracks close to the Android app category median (142/mo).
Ranks #8,022 of 21,896 in Food & Drink (top 36.6% by revenue).
Launched Oct 23, 2017 · last updated Dec 24, 2025.
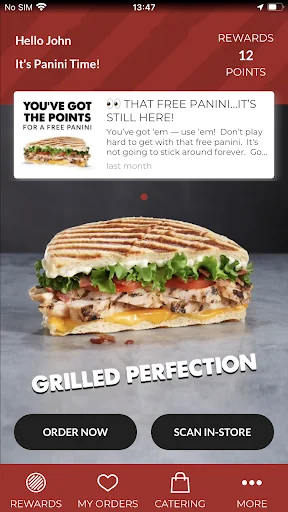
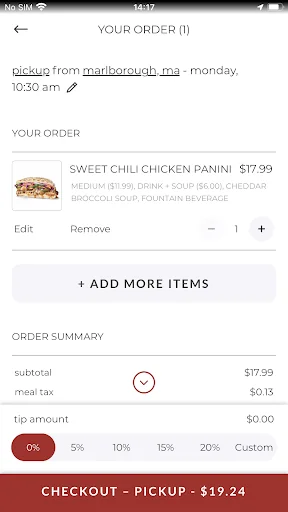
What the app looks like
Live screenshots from the Play Store, captured by our snapshot worker. Tap any image to enlarge.
Hot Table's revenue trajectory
Forecast revenue from snapshot history. Last 1 months.
Where Hot Table sits in Food & Drink
Revenue distribution of 21896 comparable apps. Hot Table highlighted.
Hot Table vs comparable apps
Revenue trajectory side-by-side. Bold = Hot Table, ghosted = peers.
App spec
Version
2.3.4
Last update
Dec 24, 2025
Launched
Oct 23, 2017
Price
Free
Monetization
Free
What Hot Table actually does (from store listing)
The Hot Table app is a convenient way to order pickup & delivery, scan and pay in-store, plus unlock many exclusive benefits.
MOBILE ORDERING
Order ahead and have your food ready when you arrive, OR better yet, have it delivered right to your door.
DELICIOUS PERKS
Receive special offers and gain early access to new menu items & promotions.
EARN REWARDS
Scan or order online to earn points. Receive one point for each panini (and salad) — When you hit 12 points (10 for salad), your next…
The Hot Table app is a convenient way to order pickup & delivery, scan and pay in-store, plus unlock many exclusive benefits.
MOBILE ORDERING
Order ahead and have your food ready when you arrive, OR better yet, have it delivered right to your door.
DELICIOUS PERKS
Receive special offers and gain early access to new menu items & promotions.
EARN REWARDS
Scan or order online to earn points. Receive one point for each panini (and salad) — When you hit 12 points (10 for salad), your next one is free!
MANAGE YOUR GIFT CARDS
Add your gift cards, check your balance, add money and redeem in-store or online.
Comparable Android apps
The five apps in Food & Drink with the closest revenue to Hot Table. Click any to see its detail page.
Each forecast combines App Store rating, ratings count, monetisation model, pricing tier, IAP signals and ad-supported flag.
The base estimate is then multiplied by a per-category scaling factor learned from apps with founder-verified MRR.
Every number on this page comes from public APIs and bumetric's own snapshot history.
Full methodology covers input variables, accuracy bands per category and how we treat apps without comparable anchors.
See also the live data on Hot Table's tracker page for current rating, reviews and snapshot timeline.
Building something similar? Get a free AI audit with $-revenue forecasts for every recommendation.


 Барракуда | Дмитров
 one2three
 Pekara Dubravica
 Tap A Meal
 Hawaiian Bros