ML revenue forecast.
Calibrated against 31082 apps in this category.
Confidence band
±15%
High — many comparable apps with verified data
At a glance
Earns 2.37× more than the category median (146/mo).
Ranks #3,642 of 31,082 in Shopping (top 11.7% by revenue).
Launched Apr 16, 2021 · last updated Apr 10, 2026.
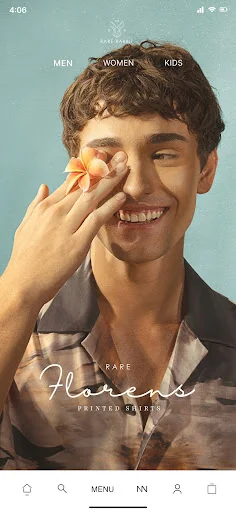
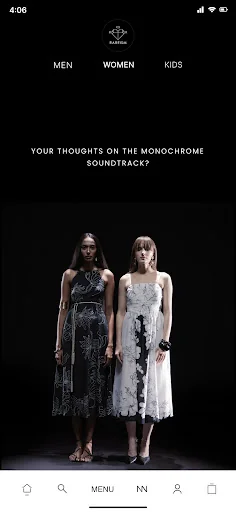
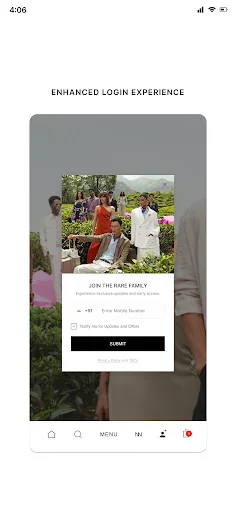
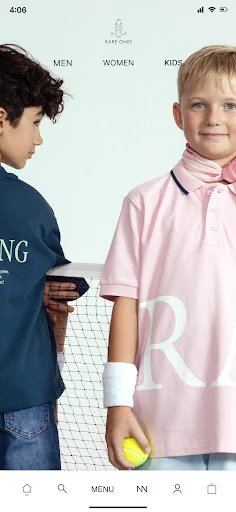
What the app looks like
Live screenshots from the Play Store, captured by our snapshot worker. Tap any image to enlarge.
HOUSE OF RARE's revenue trajectory
Forecast revenue from snapshot history. Last 1 months.
Where HOUSE OF RARE sits in Shopping
Revenue distribution of 31082 comparable apps. HOUSE OF RARE highlighted.
HOUSE OF RARE vs comparable apps
Revenue trajectory side-by-side. Bold = HOUSE OF RARE, ghosted = peers.
App spec
Version
10.1432
Last update
Apr 10, 2026
Launched
Apr 16, 2021
Price
Free
Monetization
Free
What HOUSE OF RARE actually does (from store listing)
Welcome to RARE – your ultimate fashion destination for the entire family! With the RARE app, we’ve united our three iconic brands – Rare Rabbit, Rareism, and Rare Ones – to provide a one-stop shop for premium and luxury fashion. Whether you’re looking for men’s wear, women’s collections, or kids' clothing, RARE offers a seamless shopping experience where sophistication meets innovation.
Discover RARE: Fashion for the Whole Family
Impeccably Crafted Men’s Wear:
From classic essentials to fa…
Welcome to RARE – your ultimate fashion destination for the entire family! With the RARE app, we’ve united our three iconic brands – Rare Rabbit, Rareism, and Rare Ones – to provide a one-stop shop for premium and luxury fashion. Whether you’re looking for men’s wear, women’s collections, or kids' clothing, RARE offers a seamless shopping experience where sophistication meets innovation.
Discover RARE: Fashion for the Whole Family
Impeccably Crafted Men’s Wear:
From classic essentials to fashion-forward pieces, Rare Rabbit has everything you need. Explore our meticulously designed men’s wear that blends timeless classics with contemporary trends. Whether it's a formal shirt for that important meeting, a casual T-shirt for a laid-back weekend, or a tailored blazer for an evening event, Rare Rabbit has you covered for every occasion.
Exquisite Women's Collections:
Indulge in the world of Rareism, where every piece is crafted with the modern woman in mind. From understated elegance to bold statement pieces, Rareism offers a wide range of choices. Whether you’re looking for breezy dresses perfect for daytime outings or tailored blazers that exude confidence, Rareism’s collections embody both femininity and strength.
Outfits for Your Little Ones:
Dressing your kids has never been more fun! Rare Ones presents an array of charming designs for your little trendsetters. From vibrant graphic tees for playful days to adorable dresses that combine comfort with style, Rare Ones ensures your kids are always dressed to impress.
Lifestyle | Fashion | Apparel
RARE curates a premium selection of clothing for every member of the family, ensuring you find something special for every occasion. Whether you’re in search of a classic shirt, a timeless top, or a trendy T-shirt, the RARE app has it all. Our collections span formal to casual, sophisticated to playful, and everything in between.
The RARE Brand Experience
RARE is more than a fashion brand – it’s a lifestyle. We’re committed to providing an elevated shopping experience that goes beyond clothing. Our mission is to craft experiences that resonate with those who value quality, elegance, and individuality. RARE’s aesthetic blends timeless sophistication with contemporary flair, creating a unique brand identity that appeals to discerning customers.
Why Shop with RARE?
Personalized Recommendations:
Fashion is personal, and the RARE app offers customized recommendations tailored to your style.
Early Access to Sales & New Collections:
As a valued RARE app user, you’ll be the first to know about our latest collections and exclusive sales. Get early access to new arrivals and seasonal promotions, ensuring you never miss out on the latest trends.
Seamless Checkout:
Enjoy a hassle-free shopping experience with our easy-to-navigate app. From browsing to checkout, we've streamlined the process to make it quick, simple, and secure.
Priority Shipping:
With our fast-tracked delivery service, your premium selections are prioritized and delivered straight to your doorstep in no time, with regular updates to keep you informed along the way.
Exclusive App Features:
Access special promotions, save your favorite items, and receive personalized fashion advice from our style experts through the RARE app.
Download the RARE App Now!
Secure Payments | Easy Returns | Dedicated Customer Service | Priority Shipping
Experience the best in family fashion with the RARE app. With secure payments, easy returns, dedicated customer service, and priority shipping, shopping with us is seamless. Ready to upgrade your wardrobe? Download the app now and start shopping!
Comparable Android apps
The five apps in Shopping with the closest revenue to HOUSE OF RARE. Click any to see its detail page.
Each forecast combines App Store rating, ratings count, monetisation model, pricing tier, IAP signals and ad-supported flag.
The base estimate is then multiplied by a per-category scaling factor learned from apps with founder-verified MRR.
Every number on this page comes from public APIs and bumetric's own snapshot history.
Full methodology covers input variables, accuracy bands per category and how we treat apps without comparable anchors.
See also the live data on HOUSE OF RARE's tracker page for current rating, reviews and snapshot timeline.
Building something similar? Get a free AI audit with $-revenue forecasts for every recommendation.

 West Zone : Grocery Shopping
 레미떼
레미떼
 AHA.id
 Castro
 Saturdays Lifestyle