1.2M Assets Tracked Updated just now Revenue Forecasts
Add an app Create Account Sign In
Home
Hurdles icon

How much does Hurdles earn?

Android app from Code This Lab · Sports

ML forecast ★ 2.3 · 146 Free

~184/mo

ML revenue forecast. Calibrated against 24961 apps in this category.

Confidence band
±15%
High — many comparable apps with verified data

At a glance

What the app looks like

Live screenshots from the Play Store, captured by our snapshot worker. Tap any image to enlarge.

Hurdles screenshot 1 Hurdles screenshot 2 Hurdles screenshot 3

Hurdles's revenue trajectory

Forecast revenue from snapshot history. Last 1 months.

Where Hurdles sits in Sports

Revenue distribution of 24961 comparable apps. Hurdles highlighted.

Hurdles vs comparable apps

Revenue trajectory side-by-side. Bold = Hurdles, ghosted = peers.

App spec

Version
2.04
Last update
Jul 04, 2025
Launched
Jan 22, 2020
Price
Free
Monetization
Free

What Hurdles actually does (from store listing)

Choose any of the 8 available runners and beat all the others in an exhilarating race! 
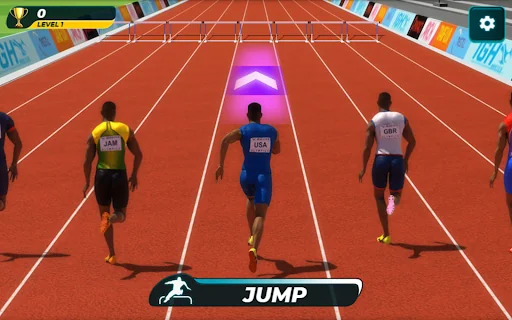
Jump over obstacles without touching them to prevent your opponents from overtaking you. Climb the podium of honor to advance to the next stage of the competition and win all 12 stages, then you will unquestionably become the winner! Use the spacebar to jump at the right time. Make perfect jumps to earn more points. Privacy Policy: https://codethislab.com/code-this-lab-srl-apps-privacy-policy-e…
Read full description →

Comparable Android apps

The five apps in Sports with the closest revenue to Hurdles. Click any to see its detail page.

AppRevenueRatingRatings
ClubNet icon ClubNet 184 0
MyPass Ski icon MyPass Ski 184 0
SGA CHS icon SGA CHS 184 0
Coach Amigo icon Coach Amigo 184 ★ 3.4 191
SMU Athletics icon SMU Athletics 184 ★ 4.2 39
Own Hurdles? Replace our estimate with your real revenue via Stripe Connect or ASC. Get a public Verified badge.
Claim & verify →

How we calculated this

Each forecast combines App Store rating, ratings count, monetisation model, pricing tier, IAP signals and ad-supported flag. The base estimate is then multiplied by a per-category scaling factor learned from apps with founder-verified MRR. Every number on this page comes from public APIs and bumetric's own snapshot history.

Full methodology covers input variables, accuracy bands per category and how we treat apps without comparable anchors. See also the live data on Hurdles's tracker page for current rating, reviews and snapshot timeline.

Building something similar? Get a free AI audit with $-revenue forecasts for every recommendation.
Audit my app →