Let's turn your device into a powerful IMU (Inertial Measurement Unit).
Capture data of all the sensors out of your device and develop your own algorithms, by taking advantage of an online or offline signal processing.
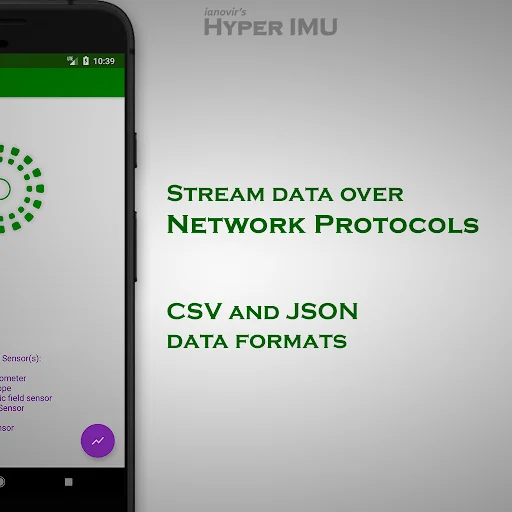
HyperIMU exposes all sensors' data via network protocols (TCP, UDP) or collects them into a file for an offline processing.
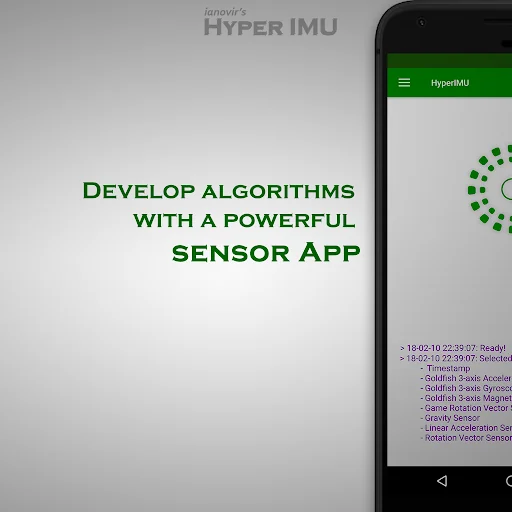
With HyperIMU you can also watch the signal charts at run-time.
<b>Features:</b>
★ CSV or JSON data streaming
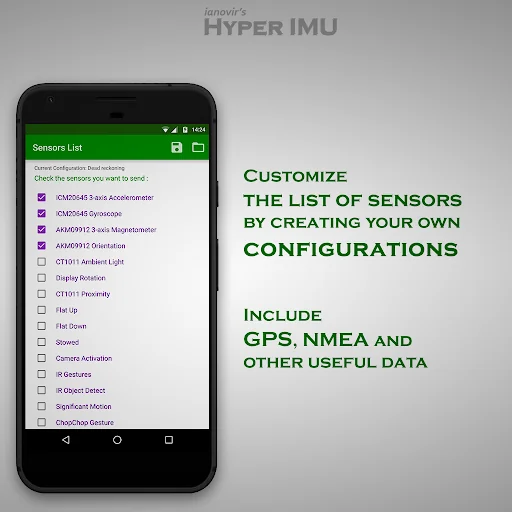
★ Fully configurable list of sensors…
Let's turn your device into a powerful IMU (Inertial Measurement Unit).
Capture data of all the sensors out of your device and develop your own algorithms, by taking advantage of an online or offline signal processing.
HyperIMU exposes all sensors' data via network protocols (TCP, UDP) or collects them into a file for an offline processing.
With HyperIMU you can also watch the signal charts at run-time.
Features: ★ CSV or JSON data streaming
★ Fully configurable list of sensors to stream
★ Customizable sampling rate
★ Including GPS and GPS NMEA 0183 data
★ Real-time signal charts viewer
★ Network stream protocols: UDP, TCP
★ .CSV file storing
★ User-friendly interface
★ Highly customizable stream packet
★ Persistent connection
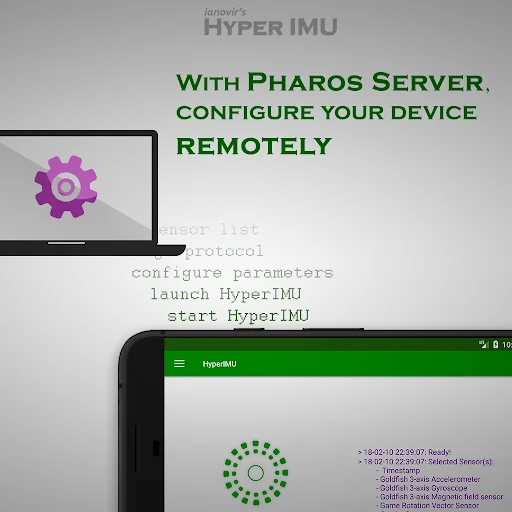
Download the HIMU-Server Python code here : https://github.com/ianovir/HIMUServer
You can find the Help here : https://github.com/ianovir/HIMUServer/blob/master/README.txt
For bug reports and suggestions, please contact the developer via email.
Comparable Android apps
The five apps in Tools with the closest revenue to HyperIMU. Click any to see its detail page.
Each forecast combines App Store rating, ratings count, monetisation model, pricing tier, IAP signals and ad-supported flag.
The base estimate is then multiplied by a per-category scaling factor learned from apps with founder-verified MRR.
Every number on this page comes from public APIs and bumetric's own snapshot history.
Full methodology covers input variables, accuracy bands per category and how we treat apps without comparable anchors.
See also the live data on HyperIMU's tracker page for current rating, reviews and snapshot timeline.
Building something similar? Get a free AI audit with $-revenue forecasts for every recommendation.

 Latest Versions Update Info
 Fast gloo wall
 Explorer+ File Manager
 Virtual 5G
 CalendarioCL